System architecture relies on clear documentation to ensure stability and scalability. A deployment diagram provides a static view of the physical architecture of a system. It maps the software components onto the hardware infrastructure. This visualization helps stakeholders understand how data moves between physical devices and logical nodes.
Understanding the physical layout is crucial for operations teams and developers alike. It bridges the gap between logical design and actual implementation. Without this map, troubleshooting network issues or planning capacity becomes difficult. The diagram serves as a blueprint for the runtime environment.
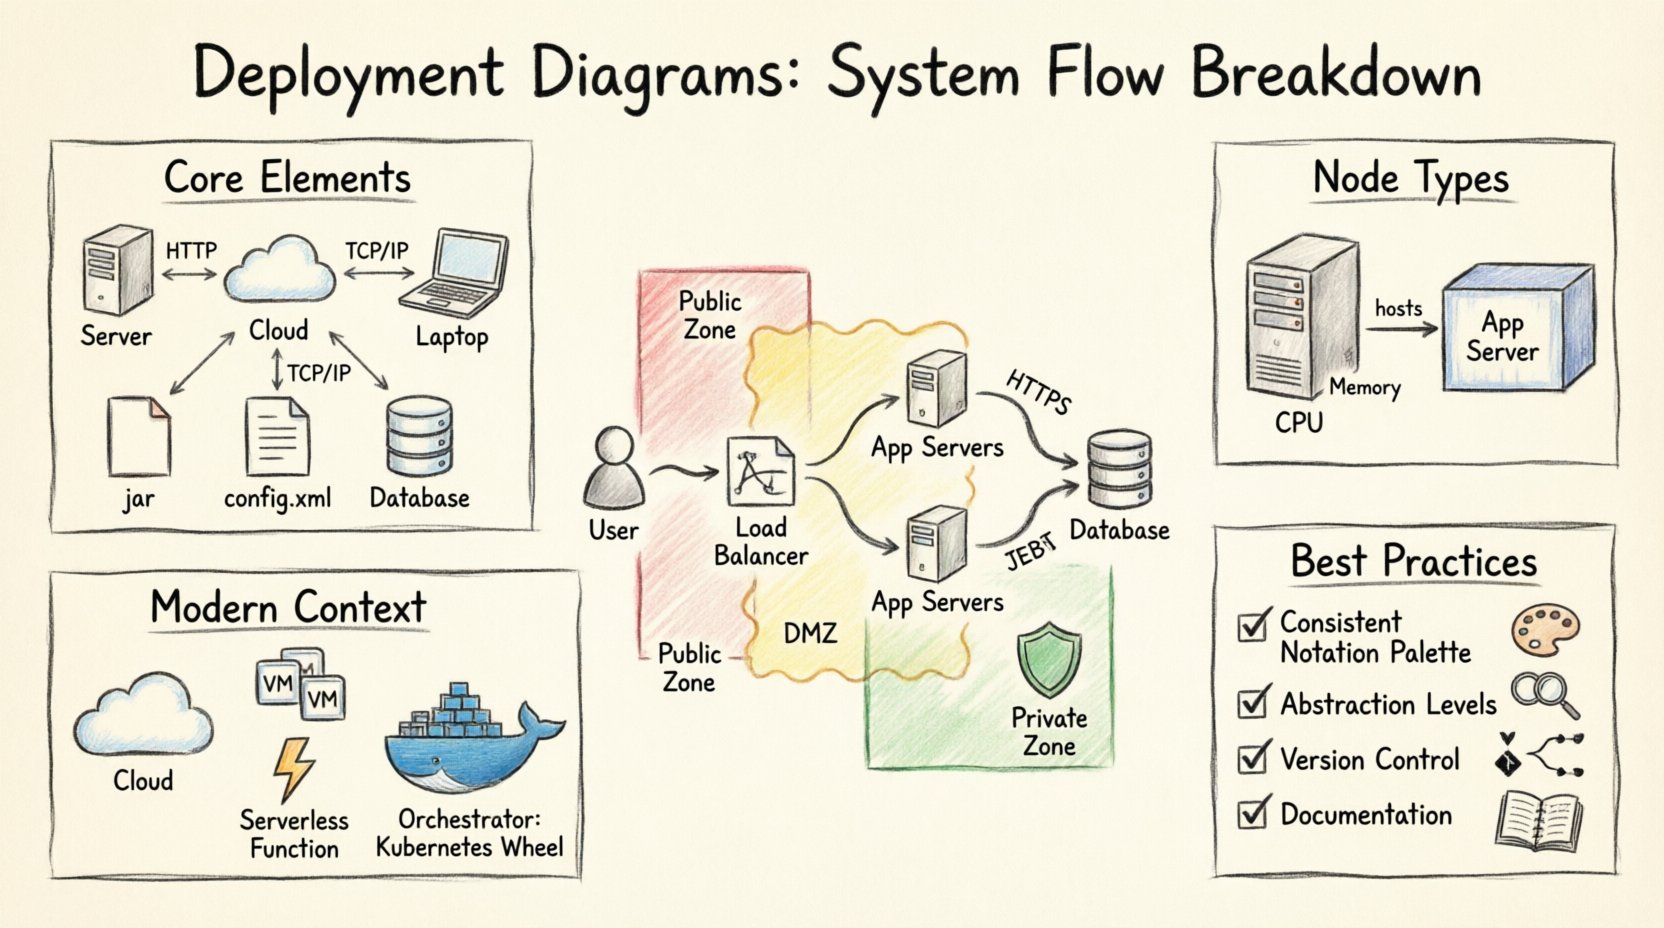
Core Elements of a Deployment Diagram 🧱
To interpret these diagrams correctly, one must understand the fundamental building blocks. Each symbol carries specific meaning regarding the infrastructure. Below is a breakdown of the essential components.
- Nodes: Represent the physical or virtual hardware. These are the computing devices where software resides.
- Artifacts: Represent the software units deployed on nodes. This includes executables, libraries, and data files.
- Communication Paths: Lines connecting nodes or artifacts. They indicate the protocol and direction of data flow.
- Dependencies: Relationships showing that one component requires another to function.
- Stereotypes: Labels that provide additional context about a node or artifact type.
Understanding Nodes
Nodes are the active elements in the infrastructure. They are typically represented as 3D boxes. There are two main categories of nodes.
- Physical Nodes: These represent actual hardware devices. Examples include servers, routers, and workstations. They have specific characteristics like CPU type, memory size, and operating system.
- Logical Nodes: These represent execution environments that may not map directly to a single physical device. Examples include application servers, database management systems, or container runtimes.
When drawing a diagram, it is important to distinguish between the device and the environment running on it. A single physical server might host multiple logical nodes. This abstraction allows architects to focus on functionality rather than specific hardware specs.
Artifacts and Components
Artifacts are the passive elements that reside on nodes. They are the actual software files. These can be compiled binaries, scripts, configuration files, or database schemas.
| Artifact Type | Description | Example |
|---|---|---|
| Executable | A program ready to run | application.jar |
| Configuration | Settings for the system | config.xml |
| Database Schema | Structure of stored data | schema.sql |
| Library | Reusable code modules | utils.dll |
Artifacts are often grouped within nodes. A node might contain a web server artifact, a database artifact, and a cache artifact. This grouping clarifies which software pieces work together on a single device.
Relationships and Connections 🔄
The lines connecting nodes and artifacts define the interactions. These relationships are critical for understanding system flow and dependencies.
Communication Paths
Communication paths show how nodes talk to each other. They usually represent network connections. The type of line indicates the protocol.
- Association: A simple link indicating a connection exists.
- Dependency: Indicates that one node relies on the functionality of another.
- Realization: Shows that a node implements an interface or capability provided by another.
Labels on the lines are essential. They specify the protocol used. Common protocols include HTTP, HTTPS, TCP/IP, or database connection strings. Without these labels, the diagram is ambiguous.
Deployment Relationships
A deployment relationship shows where an artifact is placed. It connects an artifact to a node. This relationship answers the question: “Where does this software run?”
- Instance of: The artifact is an instance of a component.
- Executes: The artifact is an executable program.
- Uses: The artifact depends on another artifact.
Reading the Architecture Flow 📊
Once the components are defined, the next step is to analyze the flow. A deployment diagram is not just a list of parts; it is a map of movement.
Data Flow Analysis
Trace the path of a request from the user to the backend. Start at the client node. Follow the communication line to the load balancer. Move from the load balancer to the application servers. Finally, reach the database node.
Identify bottlenecks in this flow. Are there too many hops between nodes? Is there a single point of failure? A well-structured diagram makes these issues visible immediately.
Security Boundaries
Security zones are often represented by enclosing boxes or shaded regions. These boundaries indicate trust levels.
- Public Zone: Accessible from the internet. Contains firewalls and gateways.
- DMZ: Demilitarized Zone. Contains public-facing services with restricted internal access.
- Private Zone: Internal infrastructure. Contains databases and sensitive application logic.
Understanding these zones helps in compliance auditing and vulnerability assessment. It ensures that sensitive data does not traverse insecure networks.
Modern Context: Cloud and Containers ☁️
Traditional deployment diagrams often depicted physical racks. Modern architecture requires a more dynamic view. Cloud environments and containerization have changed how we visualize deployment.
Cloud Infrastructure
In cloud computing, nodes are often virtual. They are provisioned on demand. The diagram must reflect the logical grouping of resources rather than physical location.
- Virtual Machines: Instances running on cloud providers.
- Serverless Functions: Code executed without managing servers.
- Managed Services: Databases and queues provided as a service.
Labels should indicate the region or availability zone. This is critical for disaster recovery planning. A diagram showing all resources in one region is a risk.
Containerization
Containers abstract the operating system. A node might host many containers. The diagram needs to show the relationship between the host node and the container instances.
- Host Node: The physical or virtual machine running the container runtime.
- Container Cluster: A group of containers working together.
- Orchestrator: The system managing the deployment and scaling of containers.
When documenting containerized systems, show the orchestration layer. This clarifies how services are discovered and how traffic is routed between them.
Best Practices for Documentation 📝
Maintaining accurate diagrams is as important as creating them. Outdated diagrams lead to confusion and errors.
Consistency
Use a consistent notation across all diagrams. If you use a specific icon for a database, use it everywhere. This reduces cognitive load for readers.
- Standard Icons: Adopt a standard set of shapes for common elements.
- Naming Conventions: Use clear names for nodes and artifacts. Avoid abbreviations that are not widely understood.
- Color Coding: Use color to denote status or type, but keep it simple.
Abstraction Levels
Do not try to show every detail in one diagram. Use different levels of abstraction for different audiences.
- High Level: For management and stakeholders. Shows major systems and connections.
- Low Level: For operations and developers. Shows specific instances and configurations.
This approach prevents clutter. A single diagram cannot effectively show the entire infrastructure of a large enterprise. Break it down by domain or service.
Version Control
Treat diagrams as code. Store them in version control systems. This allows tracking of changes over time.
- Change Log: Document why a diagram was updated.
- Review Process: Require review before updating the diagram during a release cycle.
- Automation: Use tools to generate diagrams from configuration files where possible.
Common Pitfalls to Avoid ⚠️
Even experienced architects make mistakes. Being aware of common errors helps improve the quality of the documentation.
Overcomplication
Adding too many details makes the diagram unreadable. Focus on the critical paths. Remove decorative elements that do not add value.
Missing Dependencies
Failing to show a dependency can lead to deployment failures. If Service A requires Service B, this relationship must be visible.
Inconsistent Updates
Updating the code without updating the diagram creates a disconnect. Ensure the diagram reflects the current state of the system.
Integration with Other Models 🤝
A deployment diagram does not exist in isolation. It connects with other modeling techniques.
Component Diagrams
Component diagrams show the logical structure. Deployment diagrams show the physical placement. They work together to provide a full picture.
- Component Diagram: Defines interfaces and relationships between software modules.
- Deployment Diagram: Defines where those modules are hosted.
Sequence Diagrams
Sequence diagrams show the flow of messages over time. Deployment diagrams show the static topology. Combining them helps trace a request through the system.
Final Thoughts on Visualization 🎯
Effective visualization is a cornerstone of successful system design. A deployment diagram clarifies the physical reality of the software. It helps teams align on infrastructure requirements.
Regularly reviewing these diagrams ensures the architecture evolves with the business needs. It supports better decision-making during scaling and migration projects. By focusing on clear components and relationships, teams can maintain a robust and understandable system landscape.
The effort invested in maintaining these diagrams pays off during incidents and planning sessions. It reduces the time needed to understand the environment. Ultimately, a clear map leads to a stable system.