Understanding how software moves from a developer’s machine to a live environment is critical for any engineering team. A deployment diagram provides a visual representation of the physical architecture of a system. It maps out the hardware nodes and the software artifacts that reside on them. In the context of modern cloud infrastructure, these diagrams are not just static drawings; they are blueprints for reliability, scalability, and security. 📈
This guide walks through the practical application of deployment diagrams. We will explore the components, the relationships, and the specific steps required to document your infrastructure effectively. By the end, you will have a clear understanding of how to visualize your cloud topology without relying on vendor-specific marketing. 🛠️
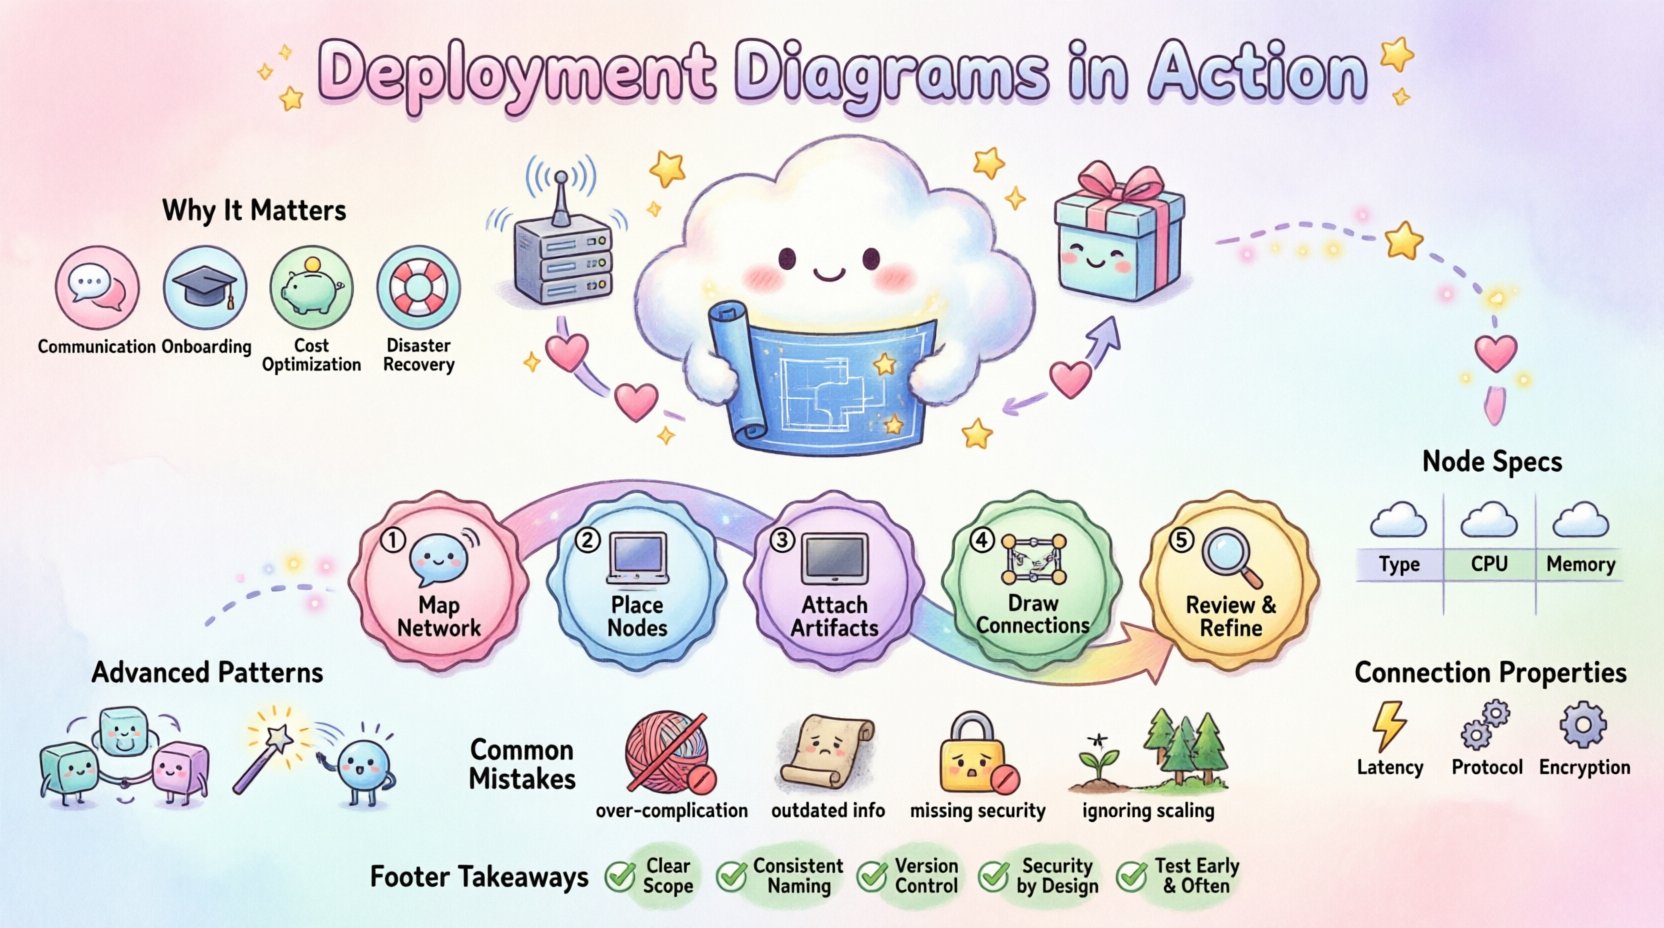
Why Deployment Diagrams Matter in Cloud Environments ☁️
Cloud infrastructure is dynamic. Resources spin up and down based on demand. A deployment diagram serves as the source of truth for what the system should look like. Without this documentation, teams often face configuration drift, where the actual state of the system diverges from the intended design. This leads to outages and security vulnerabilities.
- Communication: It helps stakeholders understand the flow of data between services.
- Onboarding: New engineers can grasp the system architecture quickly.
- Cost Optimization: Visualizing resources helps identify underutilized nodes.
- Disaster Recovery: It clarifies dependencies during a failover scenario.
Core Components of a Deployment Diagram 🧩
Before drawing the diagram, you must understand the fundamental building blocks. These elements remain consistent regardless of the specific cloud platform used. Each element represents a physical or logical entity within the infrastructure.
1. Deployment Nodes 🖥️
A deployment node represents a physical computing resource. In a cloud context, this could be a virtual machine, a serverless function container, or a physical server in a data center. The node is the host where the software actually runs.
- Server Nodes: Compute instances that host applications or databases.
- Device Nodes: Physical hardware like routers, firewalls, or load balancers.
- Execution Environment: The runtime environment, such as a container or a virtual machine instance.
2. Artifacts 📦
An artifact is a software file that is deployed onto a node. It is the actual code or configuration that performs work. Examples include executable binaries, configuration files, database schemas, or container images.
- Application Artifacts: The compiled code of your microservices.
- Database Artifacts: SQL scripts or schema definitions.
- Configuration Artifacts: YAML files, environment variables, or secret keys.
3. Communication Paths 🔗
These lines represent the network connections between nodes. They define how data moves through the system. It is crucial to distinguish between internal communication and external access.
- Internal: Traffic between microservices within the same cluster.
- External: Traffic entering from the public internet or external APIs.
- Secure: Encrypted channels, such as TLS connections.
Step-by-Step Guide to Creating a Diagram 📝
Creating a deployment diagram is a structured process. It requires gathering information about your current or planned infrastructure and translating it into a visual format. Follow these steps to ensure accuracy and completeness.
Step 1: Identify the Hardware and Network Topology 🌐
Start with the physical layer. Where is the data located? Are there multiple regions? Is there a hybrid setup involving on-premise servers?
- Map out the regions or zones.
- Identify the load balancers that sit at the edge.
- Define the subnets and network security groups.
Step 2: Define the Nodes and Instances 💻
Once the network is defined, place the compute resources. Group similar nodes together. For example, place all database instances in one cluster and all web servers in another.
- Web Tier: Load balancers and web server instances.
- Application Tier: API servers and business logic processors.
- Data Tier: Relational databases, NoSQL stores, and object storage.
- Utility Tier: Caching layers, message queues, and monitoring agents.
Step 3: Map the Artifacts to the Nodes 📂
Now, attach the software to the hardware. Show which executable runs on which node. This step clarifies the deployment strategy.
- Drag the application artifact onto the web server node.
- Place the database schema artifact onto the database node.
- Link configuration files to the specific nodes that require them.
Step 4: Establish the Connections 🛣️
Draw the lines between nodes. Use arrows to indicate the direction of data flow. Label the protocols where necessary (e.g., HTTP, TCP, gRPC).
- Ensure every node that needs to talk to another has a line connecting them.
- Label ports if they are non-standard (e.g., port 8080 vs 443).
- Indicate if the connection is asynchronous (e.g., via a message queue).
Step 5: Review and Refine 🔍
Finally, check the diagram for clarity. Is it too cluttered? Can a new engineer understand it within five minutes? Simplify where possible.
- Remove unnecessary details that do not affect the high-level architecture.
- Ensure all labels are legible.
- Verify that security boundaries are clearly marked.
Structuring Information with Tables 📊
Tables are excellent for summarizing complex deployment details that might clutter a visual diagram. Use them to define node specifications and connection properties.
Node Specifications Table
| Node Name | Type | Instance Class | Quantity | Location |
|---|---|---|---|---|
| Frontend-Node-01 | Virtual Machine | Compute Optimized | 2 | Region A |
| Backend-Node-01 | Container Cluster | Memory Optimized | 3 | Region A |
| Database-Node-01 | Managed Service | Storage Optimized | 1 (Primary) | Region A |
| Database-Node-02 | Managed Service | Storage Optimized | 1 (Replica) | Region B |
Connection Properties Table
| Source Node | Destination Node | Protocol | Port | Encryption |
|---|---|---|---|---|
| Load Balancer | Frontend-Node | HTTP/HTTPS | 443 | TLS 1.3 |
| Frontend-Node | Backend-Node | gRPC | 8080 | Internal |
| Backend-Node | Database-Node | MySQL | 3306 | SSL |
Advanced Deployment Strategies 🚀
Modern cloud environments often utilize advanced deployment patterns. These patterns change how the diagram looks and what components are included.
Microservices Architecture 🔗
In a microservices setup, you will see many small nodes rather than a few large ones. Each service runs in its own container or lightweight virtual machine. The diagram becomes more complex due to the number of inter-service calls.
- Use groupings to organize related services.
- Highlight the API Gateway as the entry point.
- Show the service mesh or internal load balancing.
Serverless Architecture ⚡
Serverless diagrams focus on functions and event triggers rather than persistent servers. The nodes are often abstracted away, represented by function boxes.
- Focus on the event sources (e.g., storage buckets, message queues).
- Map the functions that process the events.
- Illustrate the output destinations (e.g., databases, notifications).
Common Mistakes to Avoid 🚫
Even experienced architects make errors when documenting infrastructure. Being aware of common pitfalls helps maintain the integrity of your diagrams.
- Over-complication: Trying to draw every single line in the network. Focus on logical connections, not physical cables.
- Outdated Information: Failing to update the diagram after a migration. An old diagram is worse than no diagram.
- Missing Security Layers: Forgetting to show firewalls, WAFs, or encryption points.
- Ignoring Scaling: Showing only one instance when the system scales to thousands. Indicate capacity limits or auto-scaling groups.
Maintaining the Diagram Over Time 🔄
A deployment diagram is a living document. It requires maintenance as the infrastructure evolves. Treat it as code—review it during change requests and updates.
- Version Control: Store the diagram definition in a repository alongside your application code.
- Automation: Where possible, generate diagrams from Infrastructure as Code configurations to reduce manual errors.
- Regular Audits: Schedule quarterly reviews to ensure the visual matches the actual state.
Integration with Infrastructure as Code 📜
Modern practices link diagrams directly to configuration files. This ensures that the visual representation is derived from the actual deployment scripts. This approach reduces the gap between documentation and reality.
- Use text-based definition formats for diagrams.
- Integrate diagram generation into your CI/CD pipeline.
- Ensure that changes in the script trigger a diagram update.
Final Considerations for Cloud Architects 🧠
Creating a deployment diagram is more than a drawing exercise; it is an act of system design. It forces you to think about dependencies, bottlenecks, and failure points. A well-documented architecture facilitates better decision-making and smoother operations.
Keep your diagrams clean, accurate, and accessible. Ensure that the team understands the symbols and conventions used. This shared language is the foundation of effective cloud management. By following these guidelines, you establish a robust framework for your infrastructure documentation. 🏁
Summary of Key Takeaways ✅
- Deployment diagrams visualize hardware and software relationships.
- Nodes represent compute resources, while artifacts represent the software.
- Connections define the flow of data and protocols.
- Tables help summarize complex node and connection details.
- Regular maintenance is essential to prevent documentation drift.
- Integration with Infrastructure as Code improves accuracy.
- Avoid vendor-specific names to keep the diagram platform-agnostic.