In the complex world of software architecture, visualizing how systems interact with their underlying infrastructure is critical. A deployment diagram provides a static view of the physical hardware and software environment where an application runs. Unlike other diagrams that focus on code structure or user interactions, this specific type of UML diagram maps the tangible resources required to support a system.
Understanding this diagram is essential for developers, system architects, and DevOps engineers. It bridges the gap between logical design and physical reality. Without a clear picture of the deployment environment, issues regarding security, performance, and scalability often arise later in the development lifecycle. This guide breaks down the core concepts, symbols, and processes involved in creating these diagrams effectively.
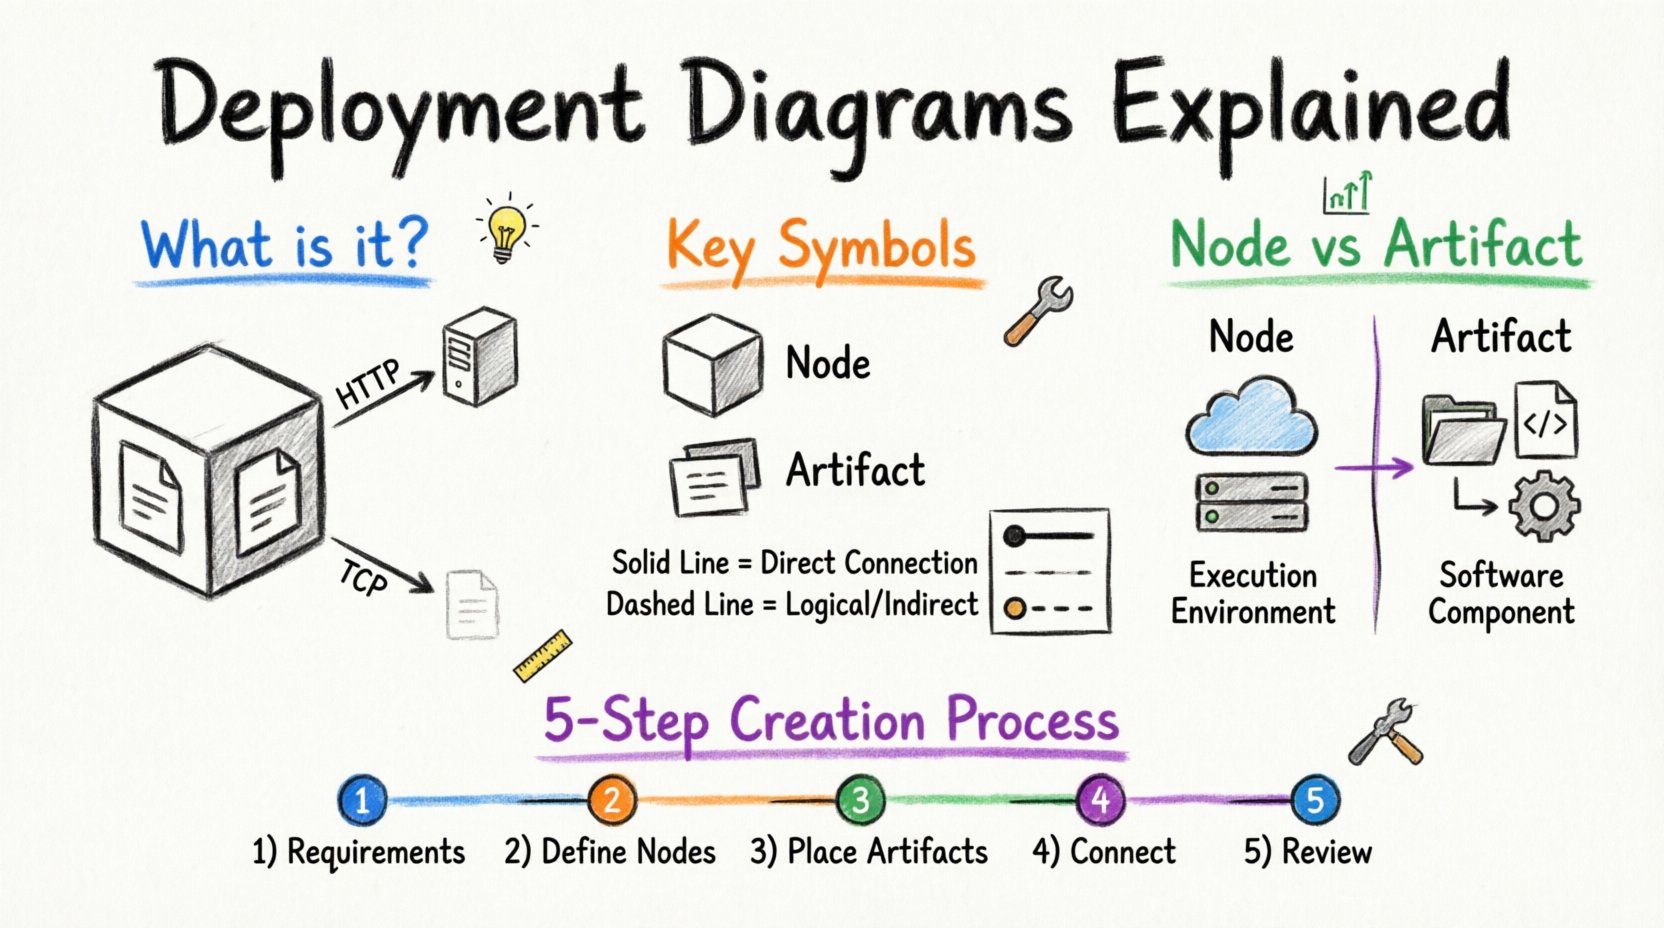
What is a Deployment Diagram? 💡
A deployment diagram is a type of Unified Modeling Language (UML) diagram. It depicts the hardware elements, or nodes, and the software artifacts that reside on them. It answers the fundamental question: where does the software actually live?
While use case diagrams describe what a system does, and class diagrams describe how the code is structured, the deployment diagram describes the physical topology. It shows the execution environment and the configuration of processing nodes.
- Physical View: It focuses on the actual machines, servers, and network devices.
- Runtime Context: It illustrates the environment where the software is executed, not just where it is developed.
- Infrastructure Mapping: It helps identify bottlenecks, redundancy points, and hardware dependencies.
This diagram is particularly valuable during the implementation and testing phases. It ensures that the software design aligns with the available infrastructure. If a system requires high availability, the diagram might show multiple nodes working in parallel. If it requires high security, it might show a dedicated firewall node separating internal databases from external clients.
Key Components and Symbols 🔧
To create a meaningful diagram, one must understand the standard notation. These symbols form the vocabulary of the diagram. Using them correctly ensures that anyone reading the document understands the architecture without confusion.
1. Nodes (Computational Resources) 🖥️
Nodes represent the physical or virtual computing resources. They are the containers for the software artifacts. In standard notation, a node is often represented by a three-dimensional cube or a rectangle with the stereotype <<node>> above it.
There are different types of nodes:
- Device: Represents a hardware device like a router, switch, or mobile phone.
- Server: Represents a general-purpose computer running server software.
- Execution Environment: Represents a virtual environment like a Java Virtual Machine (JVM) or a container runtime.
2. Artifacts (Software Items) 📦
Artifacts are the physical representations of software components. They are the files, libraries, executables, or data stores that reside on the nodes. An artifact is typically shown as a document icon or a rectangle with the stereotype <<artifact>>.
Common examples include:
- Executables: The compiled binaries that run on the server.
- Libraries: Shared code modules required by the application.
- Database Files: The actual data storage files.
- Configuration Files: Settings that control application behavior.
3. Relationships and Connectors 🔗
Connectors show the communication pathways between nodes. They define how data moves across the infrastructure. These lines often have labels indicating the protocol or technology used.
Types of relationships include:
- Association: A simple connection between two nodes.
- Dependency: Indicates that one node relies on the functionality of another.
- Communication Path: Specifies the network protocol (e.g., HTTP, TCP/IP, SSH).
| Symbol | Representation | Meaning |
|---|---|---|
| 3D Cube | Node | A computing device or environment |
| Document Icon | Artifact | A software file or data unit |
| Solid Line | Association | Direct connection between nodes |
| Dashed Line | Dependency | One node depends on another |
| Open Arrow | Usage | One node uses services from another |
Understanding Nodes and Artifacts Deep Dive 📊
Distinguishing between a node and an artifact is a common point of confusion for beginners. It is vital to maintain clarity to avoid cluttered diagrams.
The Node as a Container
A node acts as a container. Think of it as a physical box. Inside this box, you place the artifacts. The node defines the environment. For example, a Linux Server is a node. It provides the operating system, memory, and processing power. The web application running on it is the artifact.
Nodes can be nested. A virtual machine (VM) might be a node inside a physical server node. A container might be a node inside the VM. This nesting helps visualize complex cloud architectures.
The Artifact as Content
Artifacts are the contents of the node. They are the things that get installed, deployed, or executed. An artifact does not execute itself; it requires a node to run it. For instance, a database engine is an artifact. It needs a database server node to function.
Artifacts can be organized into packages. A package can group related artifacts, such as all the backend services for a specific microservice.
Table: Node vs. Artifact Comparison
| Feature | Node | Artifact |
|---|---|---|
| Role | Execution Environment | Software Component |
| Physicality | Tangible Hardware or Virtual Machine | File or Data Object |
| Example | Web Server, Database Server | WAR File, SQL Script |
| Dependency | Runs the Artifact | Runs on the Node |
Step-by-Step Creation Process 🛠️
Creating a deployment diagram is a structured process. It requires gathering requirements and mapping them to the physical infrastructure. Following a systematic approach ensures accuracy and completeness.
Step 1: Identify Requirements
Start by understanding the functional and non-functional requirements. Ask questions about performance, security, and location. Does the system need to be accessible globally? Does it require local data storage for compliance?
- Performance Needs: High traffic requires load balancers and multiple servers.
- Security Needs: Sensitive data requires isolated nodes and encryption layers.
- Scalability Needs: Growth plans might dictate a cloud-based architecture.
Step 2: Define the Nodes
List the hardware or virtual machines required. Identify the operating systems and processing capabilities needed. Group similar devices together. For example, all web servers might be grouped under a “Front End” cluster.
- Identify clients (mobile, desktop, IoT).
- Identify servers (application, database, file).
- Identify network devices (routers, firewalls).
Step 3: Place the Artifacts
Assign the software components to the nodes. Determine which files go where. Ensure that dependencies are met. For example, a database artifact must be placed on a database node, not a client device.
- Map executables to application servers.
- Map data files to storage nodes.
- Map configuration files to the relevant service nodes.
Step 4: Define Connections
Draw the lines connecting the nodes. Label these connections with the protocols used. This clarifies how data flows through the system. Be specific about the communication channels.
- Use HTTPS for secure web traffic.
- Use SSH for remote management.
- Use internal protocols for database replication.
Step 5: Review and Refine
Check the diagram for consistency. Ensure all nodes are accounted for and all artifacts have a home. Verify that the connections match the security requirements. A diagram that is too complex can be just as useless as one that is too simple.
Best Practices for Clear Visualization 📏
A good deployment diagram communicates complex information simply. It should be readable by stakeholders who may not be deeply technical. Adhering to best practices improves clarity and utility.
- Keep it High-Level: Do not show every single file. Focus on the major components and infrastructure.
- Use Stereotypes: Clearly label nodes as <<Server>> or <<Client>> to avoid ambiguity.
- Logical Grouping: Use packages or compartments to group related nodes, such as “Production” vs. “Staging”.
- Consistent Notation: Use standard UML shapes and lines to ensure industry recognition.
- Document Protocols: Always label the communication lines to show how nodes talk to each other.
- Avoid Clutter: If a diagram becomes too crowded, split it into multiple views (e.g., Front End vs. Back End).
Common Pitfalls to Avoid ⚠️
Mistakes in deployment diagrams can lead to misaligned expectations and deployment failures. Being aware of common errors helps prevent them.
1. Mixing Logic with Physicality
A frequent error is mixing the logical architecture (components) with the physical architecture (nodes). A deployment diagram should focus on the physical deployment. If you need to show logical components, use a component diagram instead.
2. Over-Specification
Detailing every IP address or specific hardware model is often unnecessary. The diagram is a blueprint, not an installation manual. Focus on the architecture, not the specific configuration details unless they are critical for the design.
3. Ignoring Network Constraints
Often, the network is treated as a black box. However, latency and bandwidth are critical. If two nodes are far apart geographically, the diagram should reflect the network layer between them.
4. Outdated Information
Infrastructure changes frequently. A deployment diagram that is not maintained becomes a source of misinformation. It should be updated whenever the infrastructure changes.
Integration with Other UML Diagrams 🧩
Deployment diagrams do not exist in isolation. They work in tandem with other UML diagrams to provide a complete picture of the system. Understanding these relationships helps in creating a cohesive documentation set.
Relation to Class Diagrams
Class diagrams show the internal structure of the software. The deployment diagram shows where the classes (compiled) are executed. A class diagram defines the logic; the deployment diagram defines the host.
Relation to Component Diagrams
Component diagrams show the software modules and their interfaces. The deployment diagram shows which node hosts which component. It is the next step in the modeling hierarchy after component design.
Relation to Sequence Diagrams
Sequence diagrams show the flow of messages over time. The deployment diagram provides the context for these messages. It tells you which nodes are sending and receiving the messages.
Relation to Use Case Diagrams
Use case diagrams show user interactions. The deployment diagram shows the infrastructure required to support those interactions. For example, a “Login” use case requires an authentication server node.
Real-World Use Cases 🌍
Deployment diagrams are used across various industries and scenarios. Here are some practical applications.
1. Cloud Migration Planning
When moving from on-premise servers to the cloud, architects use deployment diagrams to map existing hardware to cloud instances. They visualize how virtual machines and storage services replace physical racks.
2. Disaster Recovery Strategy
For high-availability systems, diagrams show redundant nodes. If one server fails, another takes over. The diagram helps identify single points of failure that need backup nodes.
3. Security Auditing
Security teams review deployment diagrams to ensure sensitive data is not exposed. They check if database nodes are behind firewalls and if external access is properly controlled.
4. Scalability Analysis
As user numbers grow, the diagram helps plan for additional nodes. It shows where load balancers should be added and how new servers should connect to existing databases.
5. Hybrid Environments
Many organizations use a mix of cloud and on-premise resources. The deployment diagram clarifies which parts of the system reside where and how they communicate across the boundary.
Conclusion on Architecture Visualization 🏁
Mastering the creation of deployment diagrams is a skill that pays dividends throughout the software development lifecycle. It transforms abstract requirements into a concrete plan for infrastructure.
By understanding the distinction between nodes and artifacts, and by following a structured process, teams can avoid costly deployment errors. The diagram serves as a communication tool between developers, operations, and management. It ensures everyone shares the same understanding of where the system lives and how it connects.
While tools exist to automate parts of this process, the conceptual understanding remains the responsibility of the architect. A well-drawn deployment diagram is a testament to a well-planned system. It reduces risk, clarifies expectations, and provides a map for future growth.
As technology evolves, with containers and serverless computing becoming common, the basic principles of the deployment diagram remain relevant. The nodes may change from physical servers to virtual functions, but the need to visualize the environment persists. Continuous learning and adaptation are key to maintaining accurate architectural models.
Start by documenting your current system. Identify the nodes and artifacts you already have. Then, map your future state. This iterative approach ensures that your documentation remains a living asset rather than a static document.
Remember that clarity is the primary goal. If a diagram is confusing, it has failed its purpose. Use standard symbols, label your connections, and keep the scope appropriate. With practice, creating these diagrams will become a natural part of your architectural workflow.