Infrastructure visualization remains one of the most critical, yet often neglected, disciplines within modern platform engineering. As systems grow in complexity, shifting from monolithic structures to distributed microservices, the need for clear, accurate representations of the underlying environment becomes paramount. A deployment diagram is not merely a static image; it is a living contract between the architecture design and the operational reality. For platform teams responsible for reliability, security, and scalability, maintaining these diagrams is a core competency.
This guide outlines the specific requirements, structural elements, and maintenance strategies needed to create deployment diagrams that actually serve their purpose. We will explore the components that constitute a valid topology, the verification steps required before a diagram is considered production-ready, and the processes to ensure the documentation does not drift from the actual infrastructure state.
🏗️ Defining the Deployment Diagram Scope
A deployment diagram visualizes the physical or logical arrangement of hardware nodes and the software artifacts deployed upon them. Unlike sequence diagrams that focus on time-based interactions, or component diagrams that focus on internal code structure, the deployment diagram focuses on the execution environment. It answers the question: Where does the code run, and how does it connect to the outside world?
For platform teams, this diagram serves as the foundational map for several critical functions:
- Incident Response: When a service fails, engineers need to know which node hosts the artifact and what dependencies it relies on.
- Security Auditing: Visualizing network boundaries and data flow helps identify exposed endpoints or unencrypted communication channels.
- Capacity Planning: Understanding the distribution of load across nodes allows for accurate resource forecasting.
- Onboarding: New engineers can grasp the system landscape faster than by reading configuration files alone.
🧱 Core Elements of Infrastructure Visualization
To ensure a deployment diagram is technically accurate, it must adhere to specific modeling standards. Each element on the canvas must represent a tangible or logical entity within the infrastructure. Ambiguity here leads to misconfiguration and deployment failures.
1. Compute Nodes
The fundamental building block is the node. In a modern environment, this could be a physical server, a virtual machine, or a container instance within an orchestration cluster. Each node requires specific metadata to be useful:
- Hardware Specifications: CPU architecture, memory capacity, and storage type (SSD vs. HDD).
- Operating System: The kernel version and distribution are critical for patch management.
- Region/Zone: Geographic location and availability zone placement determine latency and fault tolerance.
2. Software Artifacts
Artifacts represent the executable units deployed to the nodes. These include binaries, libraries, configuration files, and containers. The diagram should clarify:
- Versioning: Which specific build or revision is running on which node?
- Dependencies: What external libraries or runtimes are required for the artifact to function?
- Statefulness: Does the artifact hold state locally, or is it stateless and reliant on external storage?
3. Communication Channels
Connections define how artifacts interact. These links must specify the protocol and the port. Generic lines are insufficient for technical documentation.
- Protocol: HTTP, gRPC, TCP, UDP, or message queue protocols.
- Port Numbers: Specific ports must be documented to avoid firewall conflicts.
- Encryption: Indicate if the channel uses TLS or SSL encryption.
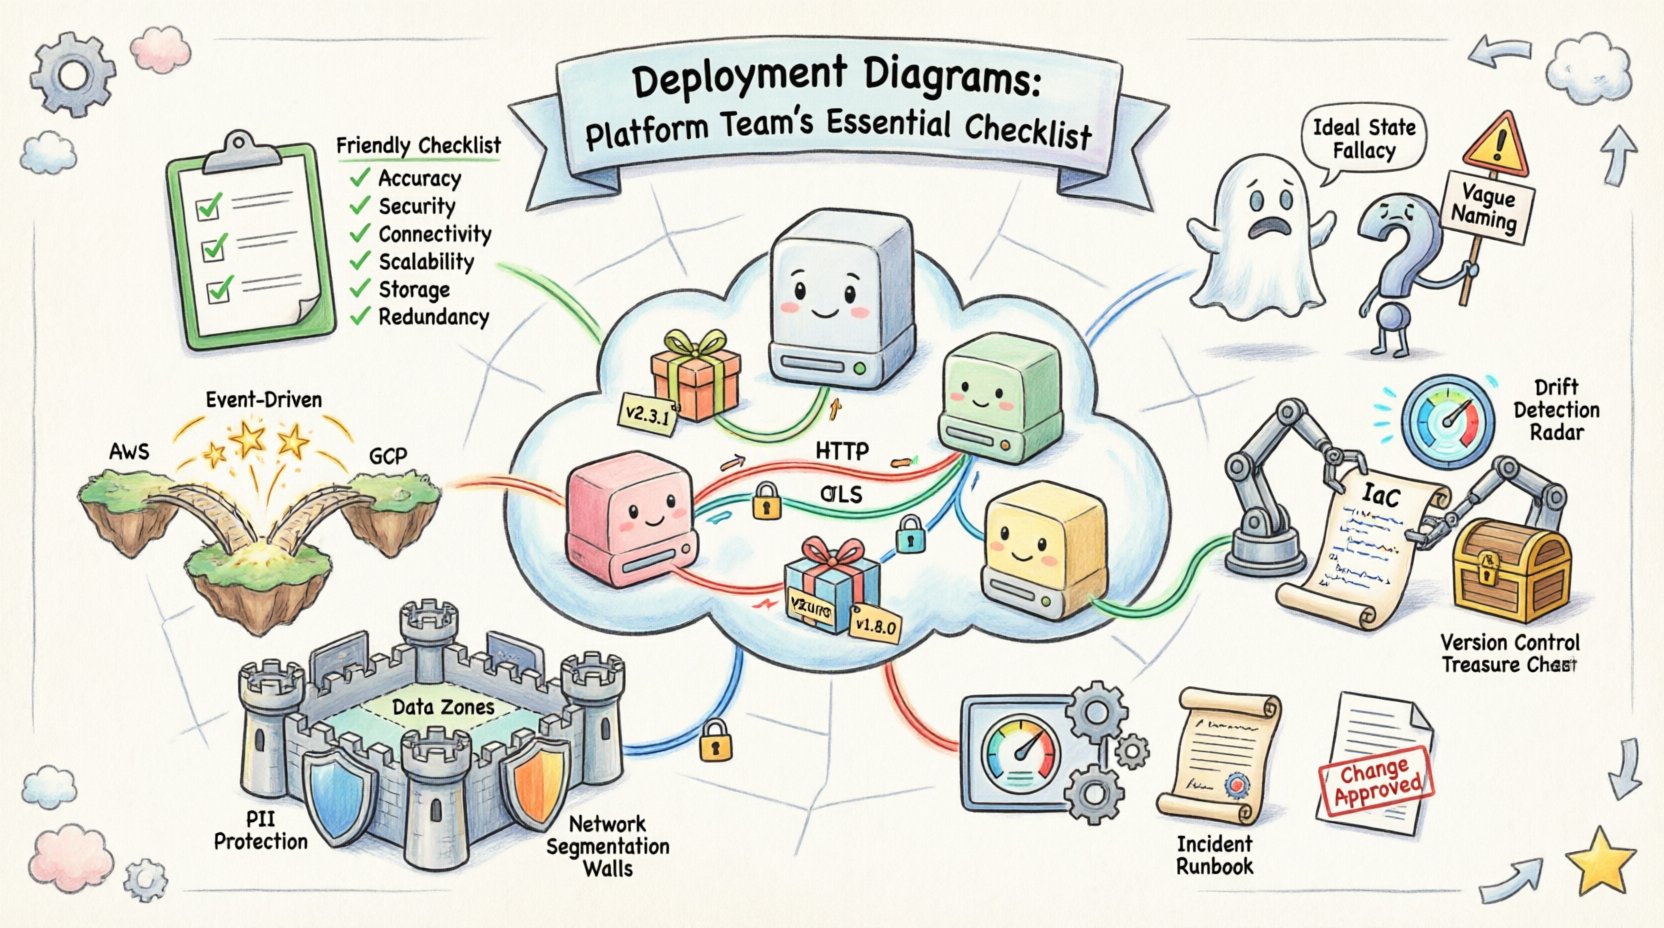
📋 The Platform Team Verification Checklist
Before a deployment diagram is integrated into a knowledge base or used for operational decision-making, it must pass a rigorous verification process. This checklist ensures the diagram aligns with the current system state and provides actionable insights.
| Category | Check Item | Validation Criteria |
|---|---|---|
| Accuracy | Topology Matches Reality | Compare diagram against live infrastructure inventory. |
| Security | Network Boundaries Defined | Identify DMZ, internal, and external zones clearly. |
| Connectivity | Ports and Protocols Listed | Verify open ports against security group rules. |
| Scalability | Auto-scaling Groups Shown | Indicate minimum and maximum node counts. |
| Storage | Volume Attachment Points | Map persistent storage to specific nodes or services. |
| Redundancy | Failover Paths | Show secondary paths for critical dependencies. |
🚫 Avoiding Common Modeling Errors
Even experienced architects can introduce errors into their diagrams. These mistakes often stem from a desire to simplify too much or to model the ideal state rather than the actual state. Recognizing these pitfalls early saves significant time during troubleshooting.
1. The Ideal State Fallacy
It is common to draw a diagram that represents how the system should work, not how it does work. For example, showing a direct connection between two services that are actually mediated by a load balancer or API gateway. Always model the traffic path as it traverses the network.
2. Missing Dependency Layers
Diagrams often focus on application layers while ignoring the platform services beneath them. Database clusters, caching layers, and message queues must be depicted as nodes. If a service relies on a Redis instance, that instance must appear on the diagram.
3. Vague Naming Conventions
Labels such as “Server 1” or “Database” are insufficient. Use descriptive identifiers like “Web-Node-Prod-A-01” or “Primary-Postgres-Cluster-01.” This reduces ambiguity when cross-referencing logs and monitoring alerts.
4. Ignoring Data Flow Direction
Undirected lines imply bidirectional communication, which is rarely the case in distributed systems. Use arrows to indicate the primary direction of data flow. This helps in understanding where data is generated and where it is consumed.
🔄 Keeping Diagrams in Sync with Reality
The greatest challenge in maintaining deployment diagrams is the inevitability of change. Infrastructure is dynamic; nodes are spun up, configurations are updated, and services are retired. A diagram that is not updated is worse than no diagram at all, as it provides false confidence.
1. Integration with Infrastructure as Code
The most effective way to maintain accuracy is to link the diagram generation process to the Infrastructure as Code (IaC) repository. When a change is made to the provisioning scripts, the diagram should be regenerated or flagged for review. This ensures that the visual representation is derived from the source of truth.
2. Automated Drift Detection
Implement monitoring systems that compare the live infrastructure against the diagram definition. If a new node is added outside of the provisioning process, the system should alert the platform team. This prevents configuration drift from accumulating unnoticed.
3. Versioning the Diagrams
Treat the diagram files with the same version control rigor as application code. Store them in a repository with commit history. This allows teams to rollback to a previous topology if a recent change introduces instability. Tag versions to correspond with major releases or infrastructure migrations.
🔒 Security and Compliance Considerations
Deployment diagrams are often reviewed during security audits and compliance checks. They provide visibility into data movement and access controls. A well-documented diagram can significantly reduce the time required for a security assessment.
1. Identifying Data Sensitive Zones
Mark areas where sensitive data resides. Use distinct visual indicators for nodes handling Personally Identifiable Information (PII) or financial records. This highlights where encryption and access control policies must be strictly enforced.
2. Network Segmentation
Clearly delineate network segments. Show which nodes are accessible from the public internet and which are restricted to internal traffic. This is crucial for defining Zero Trust architecture boundaries.
3. Audit Trails
Ensure the diagram indicates which user or role is responsible for each node. This supports accountability and makes it easier to trace the origin of a configuration change during an incident review.
🛠️ Integrating Diagrams into Operational Workflows
A diagram that sits in a document repository is a static artifact. To provide value, it must be integrated into the daily workflows of the platform team. This involves making the information accessible and actionable.
1. Linking to Monitoring Dashboards
Hyperlink nodes in the diagram to their corresponding monitoring dashboards. When a node turns red in the diagram, clicking it should take the engineer directly to the metrics for that specific instance.
2. Incident Runbooks
Include the relevant portion of the deployment diagram in incident runbooks. During a Sev-1 event, engineers need to see the topology immediately. Embedding the image ensures they understand the context of the failure.
3. Change Management Reviews
Require diagram updates as part of the Change Advisory Board (CAB) approval process. No infrastructure change is approved without a corresponding update to the topology documentation. This enforces discipline and keeps the records current.
📈 Advanced Modeling for Complex Environments
As systems evolve, simple node-and-line diagrams may not capture the full complexity of the environment. Platform teams should consider advanced modeling techniques for specific scenarios.
1. Multi-Cloud Topologies
When infrastructure spans multiple cloud providers, use distinct visual styles to represent each environment. This prevents confusion regarding latency, data egress costs, and dependency limits between clouds.
2. Hybrid Architectures
For hybrid setups involving on-premises hardware and cloud resources, clearly mark the connection points (e.g., Direct Connect, VPN). Highlight where the boundary lies between the managed cloud service and the self-managed infrastructure.
3. Event-Driven Flows
In serverless environments, traditional node diagrams are less effective. Supplement the deployment map with event flow diagrams that show how triggers propagate through the system. This clarifies the asynchronous nature of the architecture.
📝 Summary of Best Practices
Maintaining high-quality deployment diagrams requires a commitment to accuracy and consistency. The following points summarize the essential takeaways for platform teams:
- Accuracy over Aesthetics: A simple diagram that is correct is better than a complex one that is wrong.
- Automate Where Possible: Use tools to generate diagrams from infrastructure definitions to reduce manual effort.
- Update on Change: Treat diagram updates as mandatory for every infrastructure change.
- Secure the Diagram: Be aware that diagrams reveal architecture details. Control access to them as you would sensitive configuration files.
- Standardize Notation: Adopt a consistent set of symbols and labels across all projects to ensure team-wide understanding.
By treating deployment diagrams as a critical component of the platform infrastructure, teams can improve operational efficiency, enhance security posture, and reduce the cognitive load during critical incidents. The effort invested in modeling these systems pays dividends in stability and speed.
🔗 Next Steps for Implementation
To begin improving your current documentation, conduct a gap analysis. Review your existing diagrams against the verification checklist provided earlier. Identify the areas where the documentation is most stale or inaccurate. Prioritize fixing the diagrams for the most critical services first. Establish a process for review and update within your existing sprint cycles. Over time, the discipline of maintaining these maps will become a standard part of your engineering culture, leading to a more resilient and observable platform.