When designing complex software systems, visualizing behavior is as critical as writing the code itself. The UML Interaction Overview Diagram (IO Diagram) serves as a bridge between high-level activity flows and detailed sequence interactions. It allows architects and developers to map out control flow logic without getting lost in message details immediately. However, creating these diagrams often leads to confusion if specific conventions are not followed. This guide provides a structured approach to building clear, unambiguous diagrams that facilitate communication across teams. 🛠️
Understanding the Interaction Overview Diagram 🧠
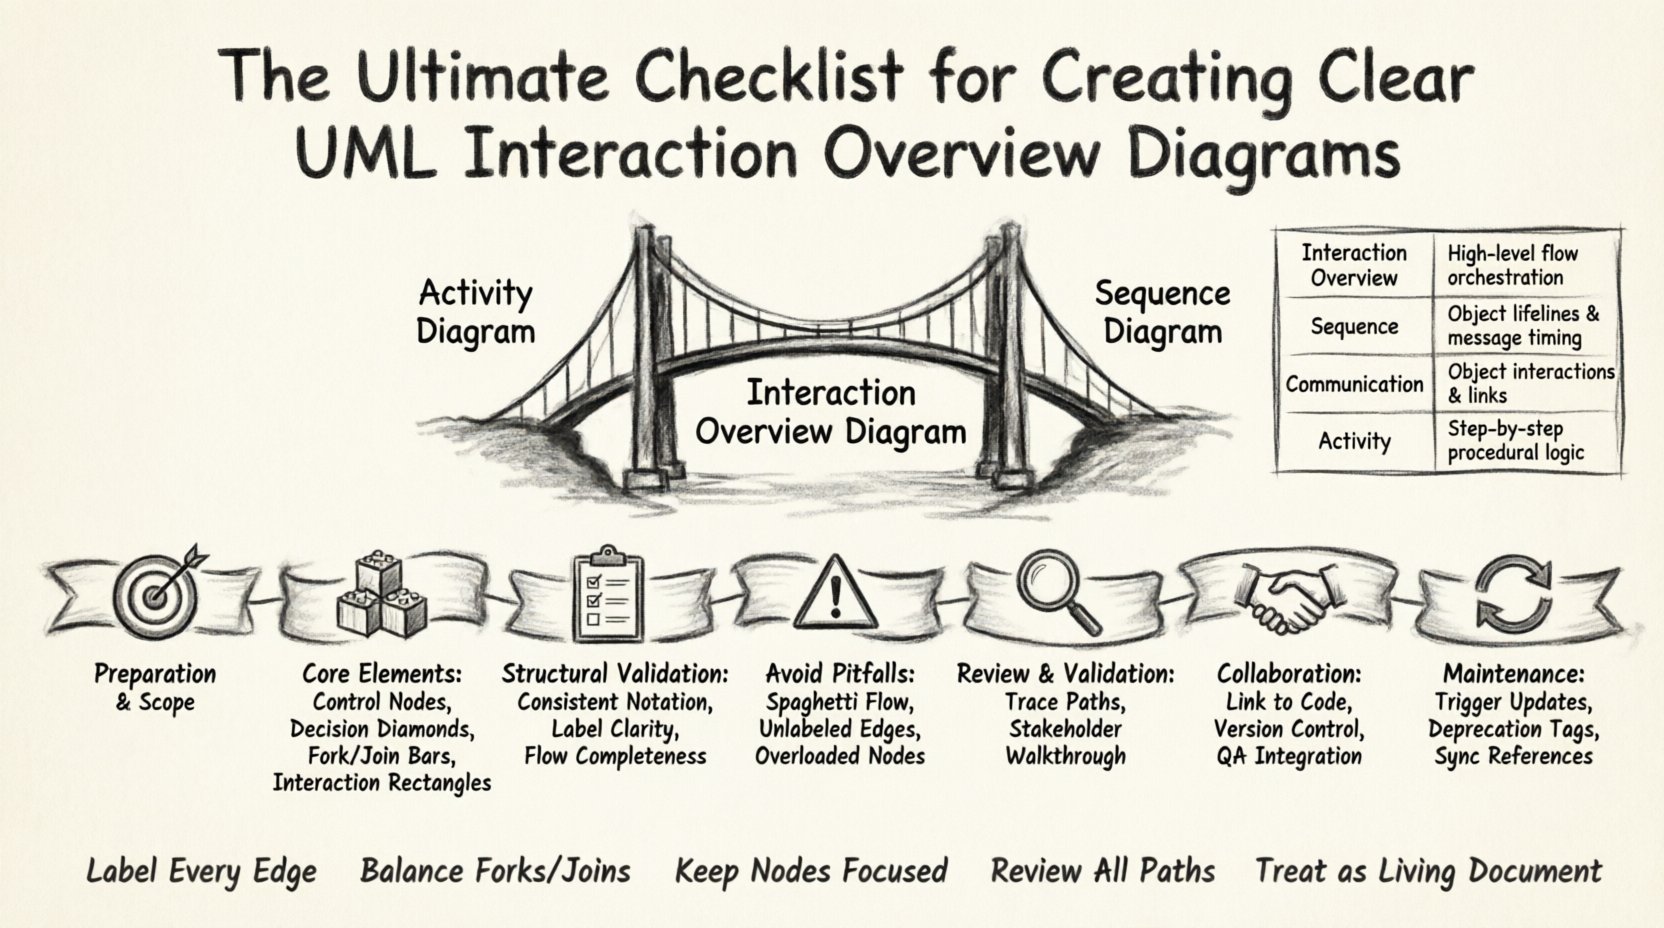
An Interaction Overview Diagram is a variation of an Activity Diagram where activity nodes are replaced by interaction diagrams. It represents the high-level orchestration of interactions between objects or actors. Unlike a Sequence Diagram, which focuses on the time-ordered exchange of messages between specific participants, an IO Diagram focuses on the control flow logic that dictates when those interactions occur.
Clarity in this diagram prevents a common pitfall: the disconnect between architectural intent and implementation reality. When the control flow is ambiguous, developers may implement logic that differs from the design specification. This leads to technical debt and integration errors later in the lifecycle.
To ensure effectiveness, the diagram must balance detail with abstraction. Too much detail obscures the flow; too little detail leaves questions unanswered. The following sections outline the steps to achieve this balance through a rigorous checklist.
Phase 1: Preparation and Scope Definition 🎯
Before drawing a single node or arrow, the scope must be defined. Ambiguity often stems from unclear boundaries. Are you modeling a single use case or a subsystem? The level of detail depends on the audience. Stakeholders need high-level flow; developers need logic paths.
Key Preparation Items
- Identify the Entry and Exit Points: Every interaction overview must have a clear start node and a distinct end node. Avoid diagrams that appear to stop mid-process without resolution.
- Define the Actors: List all external entities (users, other systems, hardware) involved in the flow. Ensure they are represented consistently throughout the diagram.
- Map Pre-conditions: Note any state requirements that must exist before the interaction begins. This prevents assumptions about the system state.
- Set the Context: Determine if this diagram covers a specific error scenario, a happy path, or both. Often, separating error handling into a different view improves readability.
Phase 2: Constructing the Core Elements 🏗️
The visual language of the Interaction Overview Diagram relies on specific UML symbols. Misusing these symbols is a primary source of communication errors. Each node type conveys a specific meaning regarding control flow.
Control Flow Nodes
- Control Nodes: These represent the flow of control within the diagram. They include:
- Fork and Join: Used to model parallel flows. Ensure that every fork has a corresponding join to avoid orphaned threads in logic.
- Decision Nodes: Diamond-shaped nodes where the flow branches based on a condition. Each outgoing edge must have a label describing the condition (e.g., “True”, “False”, “Success”, “Failure”).
- Initial and Final Nodes: The black filled circle for start and the black filled circle with a border for end. Do not mix these with activity nodes.
Interaction Nodes
- Interaction Fragments: These are the rectangular nodes containing a sub-diagram (usually a Sequence Diagram). They represent a block of logic.
- Labeling: The label on the interaction node should describe the interaction’s purpose, not just the name of the sequence diagram. Use action-oriented phrasing (e.g., “Process Payment” instead of “Payment Sequence”).
Phase 3: The Structural Checklist ✅
Structural integrity is the backbone of a readable diagram. Use the following checklist during the drafting phase to ensure the diagram is valid and understandable.
| Checklist Item | Priority | Validation Criteria |
|---|---|---|
| Consistent Notation | High | Are all diamonds, bars, and rectangles drawn according to standard UML specifications? |
| Label Clarity | High | Do all decision edges have clear labels? Are interaction nodes named descriptively? |
| Flow Completeness | High | Does every path lead to a final node? Are there unreachable areas? |
| Parallelism | Medium | Are forks and joins balanced? Is the intent of parallel execution clear? |
| Complexity Management | Medium | Is the diagram too crowded? Consider splitting into sub-diagrams if nodes exceed 20. |
| Edge Direction | Medium | Do arrows point in the direction of time or control flow? Avoid circular arrows unless modeling loops. |
Phase 4: Avoiding Common Pitfalls ⚠️
Even with a checklist, specific patterns tend to cause confusion. Being aware of these traps allows you to design around them proactively.
1. The “Spaghetti” Flow
When control flow lines cross excessively, the diagram becomes unreadable. This is common in complex business logic. To mitigate this:
- Group Related Logic: Use nested interaction nodes to encapsulate complex sub-processes.
- Use Page References: If a flow is too long, reference a continuation on another page or diagram.
- Minimize Crossing: Reorder nodes to reduce line intersections. While this takes extra time, it significantly reduces cognitive load.
2. Ambiguous Decision Logic
Decision nodes are the most frequent source of misunderstanding. A common error is leaving an edge unlabeled.
- Always Label Edges: A decision node with two outgoing paths must have labels for both. Do not assume the reader knows which path is the default.
- Use Guard Conditions: If a condition is complex, write the condition on the edge (e.g., [user is authenticated]) rather than just “Yes/No”.
- Check Exhaustiveness: Ensure all possible outcomes are covered. A missing “Else” condition implies a logic gap.
3. Overloading Interaction Nodes
An interaction node should not contain too much detail. It acts as a window into a sequence diagram, not a replacement for it.
- Focus on the Interface: The node should show the inputs and outputs of the interaction, not every message passed internally.
- Keep Nodes Small: If an interaction node requires more than 10 steps to explain, consider breaking it into multiple nodes.
Phase 5: Review and Validation 🧐
Once the diagram is drawn, a review process is necessary to validate accuracy and clarity. This phase is not about aesthetics; it is about logical correctness.
Review Steps
- Trace Every Path: Start from the initial node and follow every single path to a final node. Verify that no dead ends exist.
- Verify State Consistency: Check if the state of objects implied by the interaction matches the state in the Activity Diagram or Class Diagram.
- Stakeholder Walkthrough: Walk the diagram with a non-technical stakeholder. If they cannot explain the flow back to you, the diagram is too technical.
- Check for Redundancy: Are there duplicate interaction nodes that perform the same function? Consolidate them to reduce maintenance overhead.
Phase 6: Collaboration and Documentation 🤝
The diagram is a living document that supports team collaboration. It should not sit in a static repository but be part of the active discussion.
Integration with Development
- Link to Code: When possible, map interaction nodes to specific modules or functions in the codebase. This creates traceability.
- Version Control: Treat the diagram like code. Commit changes to version control systems. Document what changed in the commit message (e.g., “Updated payment flow logic”).
- Commenting: Use comments or notes to explain complex decisions. Do not rely solely on the visual representation for nuanced logic.
Communication with QA
Quality Assurance teams rely heavily on interaction overviews to design test cases. Ensure the diagram explicitly covers edge cases.
- Highlight Error Paths: Clearly mark paths that lead to error handling. Testers need to know where exceptions are expected.
- Define Test Data: The diagram implies specific data states. Document the data requirements for each interaction node to facilitate testing.
Phase 7: Maintenance and Evolution 🔄
Software requirements change. An Interaction Overview Diagram that is accurate today may be obsolete in six months. Maintenance is a continuous process.
Updating the Diagram
- Trigger-Based Updates: Update the diagram whenever the logic changes, not just when a new feature is added. Refactoring often alters control flow.
- Deprecation Tags: If a path is no longer supported, mark it as deprecated rather than deleting it immediately. This preserves historical context for legacy issues.
- Synchronization: Ensure the diagram stays in sync with the Sequence Diagrams it references. A mismatch here causes significant confusion during debugging.
Detailed Comparison of UML Interaction Types 🔍
To further clarify where the Interaction Overview Diagram fits, compare it with other interaction modeling techniques.
| Diagram Type | Primary Focus | Best Used For | Limitations |
|---|---|---|---|
| Interaction Overview | Control Flow & Logic | High-level orchestration of sequences | Does not show detailed message timing |
| Sequence Diagram | Time-Ordered Messages | Detailed API interactions between objects | Hard to read for high-level flow logic |
| Communication Diagram | Object Relationships | Showing structural connections between objects | Less clear on time sequences |
| Activity Diagram | Algorithm Flow | Business logic and procedural steps | Does not explicitly show object interactions |
Conclusion on Clarity and Precision 🏁
Building a clear UML Interaction Overview Diagram requires discipline and adherence to standards. It is not enough to simply draw the boxes and arrows; the intent must be communicated without doubt. By following the preparation, construction, and validation steps outlined in this guide, you can produce diagrams that serve as reliable blueprints for development.
Ambiguity is the enemy of software quality. Every unlabeled edge, every unbalanced fork, and every overloaded node introduces risk. Taking the time to review and refine these diagrams pays dividends in reduced rework and smoother team collaboration. Focus on precision, maintain consistency, and treat the diagram as a critical piece of technical documentation rather than an optional illustration.
Remember, the goal is not just to model the system, but to ensure everyone understands the model. When the diagram is clear, the code written from it will be consistent, and the communication between architects, developers, and testers will be seamless. This alignment is the foundation of robust software engineering practices. 🚀