Unified Modeling Language (UML) provides a standardized way to visualize the design of a system. However, certain diagram types remain obscure to those new to software architecture. Among these, the Interaction Overview Diagram often causes confusion. It sits between the high-level flow of an Activity Diagram and the detailed messaging of a Sequence Diagram.
This guide offers a deep dive into the Interaction Overview Diagram. We will explore its structure, symbols, and practical application without relying on specific tools. By the end, you will understand how to map control flow across complex interactions.
🤔 What Is an Interaction Overview Diagram?
An Interaction Overview Diagram is a specialized type of Activity Diagram. It describes the control flow of interactions between objects or components. While an Activity Diagram focuses on the flow of control within a single activity, the Interaction Overview Diagram focuses on the flow of control between multiple interaction scenarios.
Think of it as a map. The Activity Diagram shows the roads and intersections. The Interaction Overview Diagram shows which specific routes (interactions) you take on that map and how they connect.
- Purpose: To show the high-level flow of control for a complex interaction.
- Context: Used when a single Sequence Diagram is insufficient to describe the logic.
- Benefit: It reduces complexity by grouping detailed sequences into manageable nodes.
Beginners often struggle because they try to draw every message. The key is to abstract. You do not draw every single message. You draw the result of the interaction as a node in the overview.
🛠️ Core Components Breakdown
To build this diagram correctly, you must understand the specific nodes used. These are not arbitrary shapes; each represents a specific state or action in the control flow.
1. Initial Node
This is where the flow begins. It is a small solid circle. It indicates the entry point for the interaction overview.
- Visual: Small solid black circle.
- Function: Triggers the start of the control flow.
2. Activity Final Node
This represents the successful end of the entire interaction. It is a circle with a smaller filled circle inside (bullseye).
- Visual: Concentric circles.
- Function: Indicates normal termination of the process.
3. Control Flow
These are the arrows connecting the nodes. They represent the passing of control from one action to another.
- Visual: Open arrowhead.
- Function: Defines the order of execution.
4. Call Behavior Action
This is the most critical node for this diagram. It represents a call to another interaction (like a Sequence Diagram). It encapsulates the details of a specific conversation.
- Visual: Rounded rectangle with a small icon indicating a call.
- Function: Links the overview to detailed sequence logic.
- Best Practice: Use this when the interaction is complex enough to warrant its own diagram.
5. Decision Node
This is a diamond shape used to branch the flow based on a condition.
- Visual: Diamond shape.
- Function: Routes control to one of several outgoing flows.
- Requirement: Every outgoing flow must have a guard condition (e.g., [success], [error]).
6. Merge Node
Where decision nodes split, merge nodes combine. It brings multiple incoming flows back into a single path.
- Visual: Diamond shape (same as decision, but used differently).
- Function: Unifies control flow after a decision.
7. Object Flow
Unlike control flow, object flow represents the movement of data or objects.
- Visual: Open arrowhead, often dashed.
- Function: Shows data passing between activities.
📊 Comparison: Sequence vs. Interaction Overview
Understanding the distinction is vital for proper modeling. Confusion here leads to cluttered diagrams.
| Feature | Sequence Diagram | Interaction Overview Diagram |
|---|---|---|
| Focus | Detailed message exchange timing | High-level control flow of interactions |
| Complexity | High detail, low-level | Low detail, high-level |
| Scope | Single interaction scenario | Multiple scenarios combined |
| Notation | Lifelines, Messages | Activity nodes, Control Flow |
| Use Case | Designing specific method calls | Designing workflow logic across methods |
If you find yourself drawing 50 messages on a sequence diagram, consider breaking it into an Interaction Overview Diagram to manage the complexity.
🔄 Control Flow vs. Object Flow
One of the most common mistakes is mixing these two types of flow. They serve different purposes.
- Control Flow: Determines when the next step happens. It is about execution order.
- Object Flow: Determines what data is passed. It is about information transfer.
In an Interaction Overview Diagram, Control Flow is dominant. You primarily care about the logic path. Object flow is secondary but useful for showing data dependencies between interaction nodes.
🛠️ Step-by-Step Construction Guide
Building a valid diagram requires a methodical approach. Do not start drawing shapes randomly. Follow this logical progression.
- Identify the Use Case: What is the primary goal? (e.g., “Process Payment”).
- List Major Steps: Break the goal into high-level phases. (e.g., Validate User, Check Inventory, Charge Card).
- Define Interactions: For each phase, determine if it requires a complex sequence of messages. If yes, create a separate Sequence Diagram and reference it as a Call Behavior Action.
- Draw the Nodes: Place Initial Node, Activity Nodes (Calls), and Final Node on the canvas.
- Connect Flows: Draw arrows to show the order. Add Decision Nodes where conditions exist.
- Add Guard Conditions: Label your decision branches clearly. Use boolean logic.
- Review: Ensure every path leads to a Final Node.
⚠️ Common Pitfalls & Best Practices
Even experienced modelers make errors. Avoid these traps to maintain diagram clarity.
1. Too Much Detail
Do not draw every message inside the Interaction Overview. If you do, it becomes an Activity Diagram. Keep the nodes abstract. Let the linked Sequence Diagrams handle the details.
2. Missing Final Nodes
Every flow must terminate. If a decision node has two paths, both must eventually reach a Final Node. Dead ends confuse the reader and imply infinite loops.
3. Unclear Guard Conditions
Avoid generic labels like “Yes” or “No”. Use context-specific labels like [Valid Credit Card] or [Insufficient Funds]. This makes the logic self-documenting.
4. Mixing Control and Object Flow
Do not use control flow arrows to pass data. Use object flow arrows for data. Mixing them creates ambiguity about what is driving the process.
🌐 Integration with Other Diagrams
The Interaction Overview Diagram does not exist in isolation. It connects to the broader UML ecosystem.
- Use Case Diagram: The Interaction Overview implements the logic of a Use Case.
- Class Diagram: The nodes in the overview reference classes and operations defined in the Class Diagram.
- State Machine Diagram: If the interaction involves significant state changes, the State Machine can be referenced alongside the Sequence Diagram.
This integration ensures consistency. If you change a method signature in the Class Diagram, you must update the Call Behavior Action in the Interaction Overview.
📝 Real-World Scenarios
Let’s look at how this applies to practical systems.
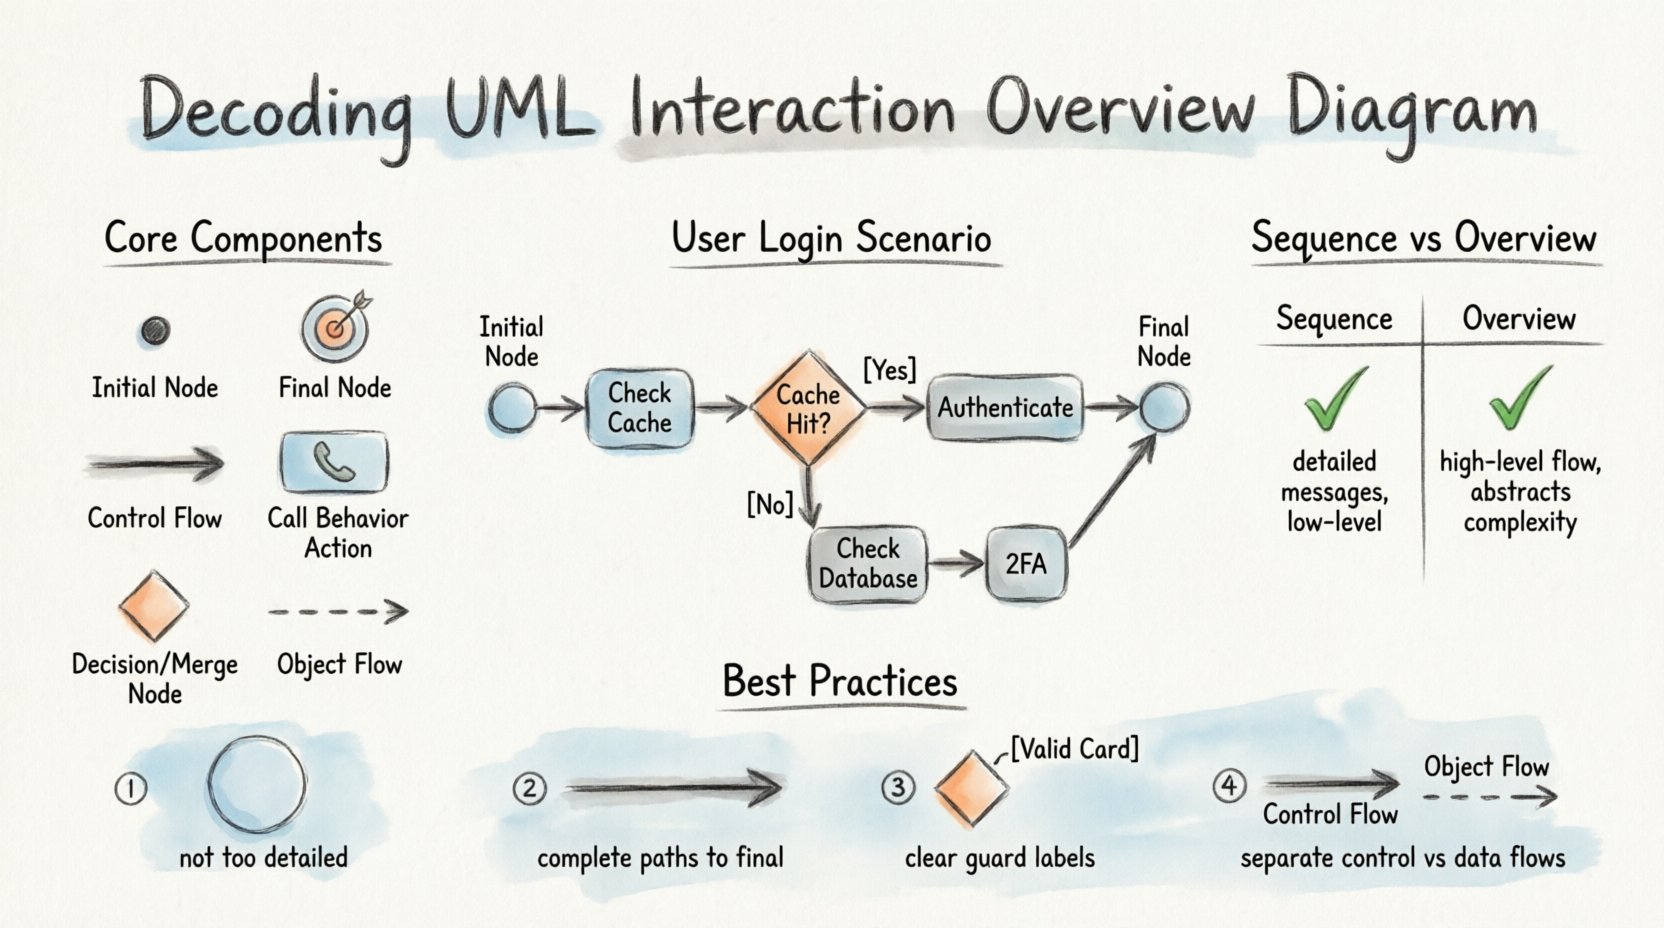
Scenario A: User Login
A simple login might just be a Sequence Diagram. But a complex login involves multiple steps: Check Cache, Check Database, Check LDAP, Handle 2FA.
- Node 1: Call “Check Cache”.
- Decision: Is cache hit?
- Yes Path: Call “Authenticate Session” -> Final.
- No Path: Call “Check Database” -> Decision -> Check 2FA.
This structure shows the branching logic without cluttering the screen with password hash comparisons.
Scenario B: Order Processing
An order goes through validation, payment, and shipping. Each of these is a major interaction.
- Node 1: Call “Validate Order”.
- Decision: Valid?
- Yes: Call “Process Payment”.
- Payment Success: Call “Generate Invoice” -> Final.
- Payment Fail: Call “Notify Customer” -> Final.
This allows stakeholders to see the business logic flow without needing to understand the database transactions inside the payment node.
🎨 Visual Syntax Rules
Consistency in drawing is key for professional documentation. Adhere to these rules.
- Alignment: Keep control flows horizontal or vertical. Avoid crossing lines where possible.
- Spacing: Leave space between nodes to allow for text labels on flows.
- Labels: Place labels on the arrow shafts, not over the shapes.
- Color: While standard UML is black and white, using color to distinguish different interaction types can help. However, ensure it works in black and white print.
🧩 Advanced Syntax: Nested Interactions
Can you call an Interaction Overview from within another Interaction Overview? Technically, yes. However, it is generally discouraged.
- Reason: It creates deep nesting that is hard to follow.
- Alternative: Use a hierarchy of Activity Diagrams where the top level is the Overview, and the lower levels are the Sequence Diagrams.
Keep the depth of your diagrams to two or three levels maximum. If you need more, you are likely modeling too much logic in one place.
❓ Frequently Asked Questions
Q: Can I use a Sequence Diagram inside an Activity Diagram?
A: Yes. This is exactly what a Call Behavior Action does. It references the Sequence Diagram as a behavior.
Q: Do I need to show every class?
A: No. Only show the classes relevant to the control flow. If a class is only used internally within a sequence, do not show it in the overview.
Q: What if the logic is circular?
A: UML supports loops via iteration nodes. However, in an Overview Diagram, you should generally show the loop condition as a decision node that feeds back to a previous step.
Q: Is this diagram mandatory for every project?
A: No. It is best used for complex systems. For simple CRUD operations, a Sequence Diagram is sufficient.
🔍 Final Thoughts on Notation
Mastering the Interaction Overview Diagram requires patience. It is a tool for abstraction. Its value lies in hiding complexity, not revealing it.
When you draw one, you are telling a story. The story is about how the system behaves under different conditions. Ensure your nodes represent meaningful steps. Ensure your flows represent logical progress.
By following these guidelines, you create documentation that is both accurate and readable. This aids communication between developers, architects, and stakeholders. Clarity in design leads to clarity in code.
Remember, the goal is not to fill the page with shapes. The goal is to make the system logic transparent. Use the Interaction Overview Diagram to illuminate the path from start to finish.