


Cloud environments are dynamic. They shift, scale, and evolve on a daily basis. Yet, the diagrams intended to represent these environments often remain static artifacts from months or even years ago. A deployment diagram is more than a drawing; it is the visual contract between engineering teams and the infrastructure they rely on. When this contract becomes outdated, the cost is paid in confusion, slower onboarding, and increased risk during incident response.
This guide explores practical strategies to keep your deployment diagrams synchronized with your actual cloud architecture. We will examine methods to reduce manual overhead, integrate documentation into the development lifecycle, and maintain accuracy without sacrificing speed. The goal is not perfection, but relevance.
📉 Why Stale Diagrams Cost Your Team Time and Reliability
When infrastructure changes faster than documentation, a disconnect forms. This disconnect manifests in several critical areas:
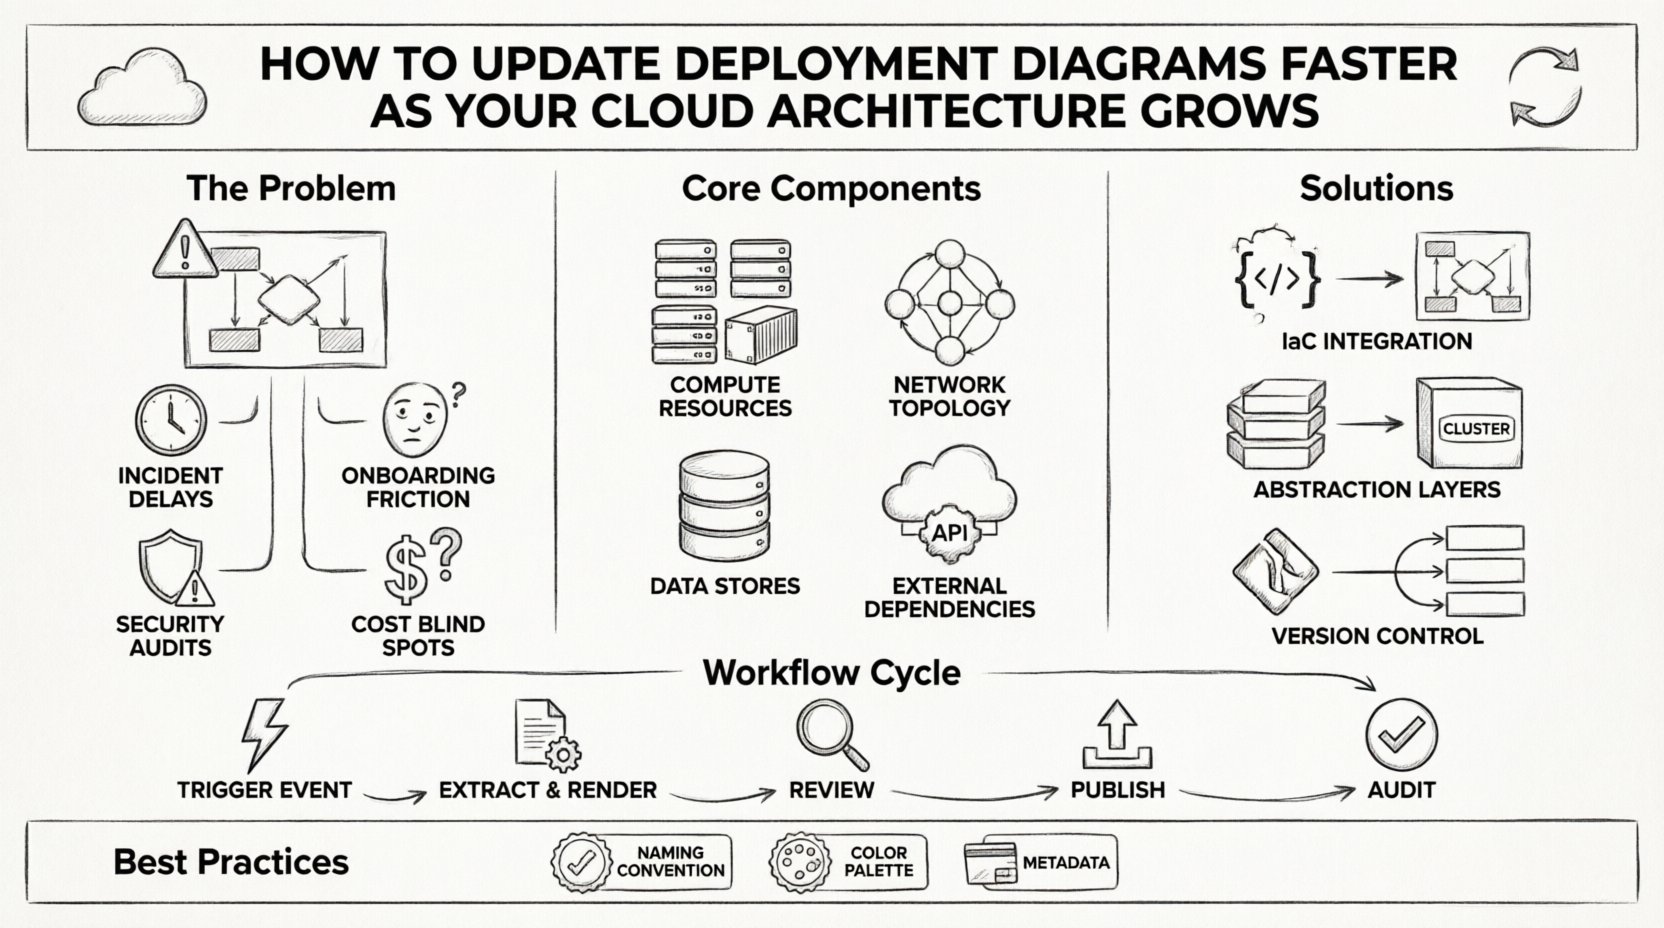
- Incident Response Delays: During a production outage, engineers consult the diagram to understand dependencies. If the diagram shows a legacy database that has been migrated to a managed service, troubleshooting time increases significantly.
- Onboarding Friction: New team members spend hours trying to map the current system against the provided visuals. This delays their ability to contribute code or manage deployments.
- Security Audits: Auditors require accurate maps of data flow and storage locations. Outdated diagrams can lead to compliance findings or missed security gaps.
- Cost Optimization Blind Spots: If the diagram does not reflect the actual resource allocation, identifying redundant or unused instances becomes a guessing game.
Addressing these issues requires a shift in mindset. Documentation should not be a separate task performed after deployment. It must be an inherent part of the architecture lifecycle.
🧩 Core Components of a Modern Deployment Diagram
To update diagrams efficiently, you must first understand what constitutes a valid representation of your cloud environment. Modern deployment diagrams have evolved beyond simple boxes and lines. They must capture the following elements:
1. Compute Resources
These are the nodes where logic executes. In a cloud context, this includes:
- Virtual machines and containers.
- Serverless function triggers.
- Managed database instances.
- Batch processing clusters.
2. Network Topology
Connectivity defines how data moves. Key components include:
- Virtual private clouds (VPC) and subnets.
- Load balancers and gateways.
- Firewalls and security groups.
- Private link connections between services.
3. Data Stores
Where information resides is critical for compliance and performance. Include:
- Relational databases.
- NoSQL document stores.
- Object storage buckets.
- Message queues and caches.
4. External Dependencies
Your system does not exist in a vacuum. Document:
- Third-party APIs.
- Identity providers.
- CDN endpoints.
- On-premise legacy systems.
🚀 Strategies for Rapid Diagram Maintenance
Manual drawing is the bottleneck. To update diagrams faster, you must leverage automation and abstraction. Here are the primary methods to achieve this.
1. Link Diagrams to Infrastructure as Code
The most accurate source of truth is your configuration repository. Instead of drawing boxes, define the architecture in code. Many tools can parse infrastructure configuration files to generate visual representations automatically.
- Template-Based Generation: Use standard templates for common resources (e.g., a web server, a database). When code changes, the visual output updates.
- State File Parsing: Export the state file from your provisioning tool. Parse this data to identify active resources and render them into the diagram structure.
- API Integration: Query the cloud provider’s API for active resources. Build a script that fetches resource types, regions, and tags to populate the diagram nodes dynamically.
2. Implement Abstraction Layers
As your architecture grows, showing every single instance creates noise. Use abstraction to maintain clarity.
- Logical Grouping: Instead of drawing 50 database instances, draw one logical “Database Cluster” node with a count annotation.
- Service Boundaries: Group microservices into functional domains. Show the domain as a single box, but allow drill-down capabilities for specific services.
- Region Aggregation: If you operate across multiple geographic regions, show the regions as distinct containers rather than individual resource nodes.
3. Version Control for Diagrams
Treat diagrams like code. Store them in your repository and track changes.
- Commit Triggers: Configure the diagram generation process to run on every merge request. This ensures the visual representation matches the intended state of the code.
- Change Logs: Maintain a history of diagram changes. If a specific service moved regions, the version history will explain why.
- Branching Strategy: Allow for “Draft” diagrams. Before merging infrastructure changes, visualize the result in a draft branch to catch topology errors early.
🔄 Implementing a Synchronization Workflow
Automation handles the heavy lifting, but human oversight ensures accuracy. Establish a workflow that keeps diagrams fresh without overwhelming your team.
Step 1: Define Trigger Events
Identify which infrastructure changes require a diagram update. Not every minor configuration tweak needs a visual change. Focus on:
- Adding or removing major components.
- Changing network connectivity paths.
- Modifying security boundaries.
- Shifting deployment regions.
Step 2: Automated Extraction and Rendering
Run the extraction script as part of your pipeline. The output should be a standardized file format (such as SVG or PNG) that is stored alongside the codebase.
- Ensure the rendering engine is consistent. Avoid manual adjustments that introduce drift.
- Use distinct colors for different environments (e.g., Production vs. Staging) to prevent confusion.
Step 3: Review and Publish
Even automated diagrams need a sanity check. Include a diagram review in your deployment checklist.
- Architecture Review Board: Present significant topology changes to the board for validation.
- Automated Validation: Use scripts to check for orphaned nodes or missing connections in the generated diagram.
- Documentation Hub: Publish the final diagram to a central knowledge base. Link this hub directly to the infrastructure repository.
📊 Comparison of Maintenance Approaches
Understanding the trade-offs between manual and automated methods helps in selecting the right path for your organization.
| Feature | Manual Maintenance | Automated/Code-Based Maintenance |
|---|---|---|
| Accuracy | Low (High risk of drift) | High (Synced with state) |
| Speed | Slow (Hours per update) | Fast (Minutes per update) |
| Scalability | Poor (Becomes unmanageable) | Excellent (Handles complexity) |
| Cost | High (Engineering time) | Medium (Tooling setup) |
| Flexibility | High (Custom styling) | Medium (Template constraints) |
| Traceability | Low (Hard to link to code) | High (Linked to commit history) |
🛡️ Best Practices for Diagram Governance
To ensure long-term success, establish governance rules around how diagrams are created and used.
Standardize Naming Conventions
Consistency is key for readability. Enforce naming rules for all nodes and connections.
- Prefixes: Use prefixes for environments (e.g., `prod-`, `dev-`).
- Resource Types: Use standard abbreviations (e.g., `db`, `lb`, `fn`).
- Regions: Clearly tag nodes with their geographic location.
Color Coding Logic
Colors convey meaning instantly. Define a legend and stick to it.
- Red: Critical components or high-risk services.
- Blue: Standard application services.
- Green: Infrastructure and networking layers.
- Gray: Deprecated or legacy components.
Tagging and Metadata
Use tags within the diagram tool or the underlying code to categorize resources.
- Owner: Which team owns this component?
- Cost Center: Where does the expense fall?
- Compliance: Does this store sensitive data?
🏛️ Handling Legacy Systems and Hybrid Scenarios
Many organizations operate in hybrid environments. You may have cloud-native services running alongside on-premise legacy systems. This complexity requires a specific approach to diagramming.
Physical vs. Logical Views
In hybrid setups, a single diagram often fails to capture the full picture. Maintain two views:
- Logical View: Focus on data flow and service dependencies, regardless of physical location.
- Physical View: Focus on hardware, network boundaries, and specific IP ranges.
Bridging the Gap
When connecting cloud services to on-premise infrastructure, visualize the connection explicitly.
- Use dashed lines to indicate cross-network connections.
- Label the connection type (e.g., VPN, Direct Connect, Public Internet).
- Highlight latency or bandwidth constraints if they are significant.
🔄 Moving Forward with Documentation Accuracy
The process of keeping deployment diagrams up to date is iterative. It requires commitment from the engineering culture to prioritize visibility as much as functionality. By integrating diagram generation into your infrastructure pipelines, you remove the burden of manual maintenance.
Focus on the value the diagram provides. If a diagram does not help engineers understand the system, it is not worth maintaining. Prioritize clarity over detail. A simple, accurate diagram is superior to a complex, outdated one.
Key Takeaways for Implementation
- Stop treating documentation as a post-project activity. Start treating it as a continuous deliverable.
- Leverage Infrastructure as Code to drive diagram generation.
- Use abstraction to manage complexity in large-scale systems.
- Establish clear governance rules for naming, coloring, and versioning.
- Regularly audit your diagrams against the actual running infrastructure.
By adopting these strategies, you ensure that your visual documentation remains a reliable asset. This reliability translates to faster deployments, fewer incidents, and a more resilient architecture. The cloud will continue to change, but your documentation can change with it.