


Designing complex software systems requires more than just writing code. It demands a clear blueprint of how different components communicate, how data flows, and how decisions are made within the architecture. Unified Modeling Language (UML) provides a standardized set of notations to visualize these interactions. Among the various diagram types, Interaction Diagrams play a pivotal role in defining system behavior.
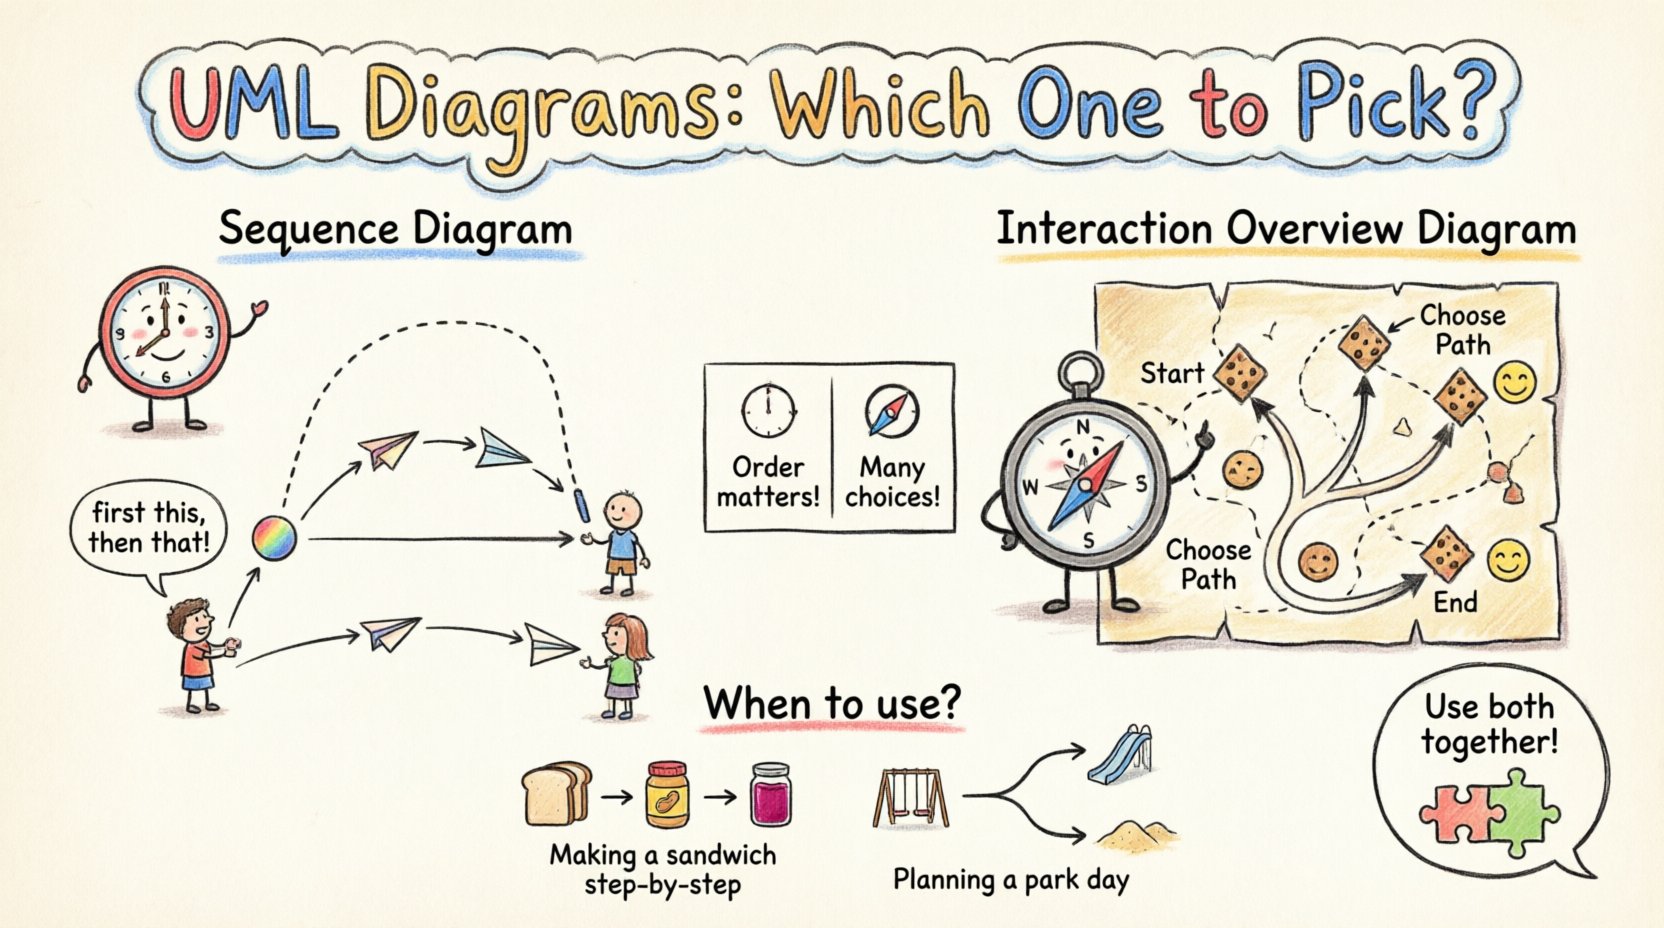
However, selecting the right type of interaction diagram can be challenging. Two of the most prominent models are the Sequence Diagram and the Interaction Overview Diagram. While they share the goal of modeling interactions, they serve distinct purposes and offer different levels of abstraction. Understanding the nuances between them is essential for architects and developers working on full-stack projects.
This guide provides a comprehensive analysis of both models. We will explore their mechanics, use cases, strengths, and limitations. By the end, you will have a clear framework for deciding which diagram best fits your specific design needs.
📐 Understanding Interaction Modeling in UML
Interaction diagrams describe the dynamic behavior of a system. They focus on how objects or components exchange messages to achieve a specific goal. Unlike static structure diagrams that show classes and relationships, interaction diagrams capture the flow of time and control.
There are two main subtypes of interaction diagrams in UML:
- Sequence Diagrams: Focus on the chronological order of messages between objects.
- Communication Diagrams: Focus on the structural organization of objects and their links.
However, when dealing with complex control logic, branching, and merging flows, standard sequence diagrams can become cluttered. This is where the Interaction Overview Diagram comes into play. It acts as a high-level activity diagram that can contain nested sequence diagrams. Choosing between them depends on the complexity of the logic and the audience you are communicating with.
🕒 The Sequence Diagram Deep Dive
The Sequence Diagram is perhaps the most widely used interaction diagram. It emphasizes the time-ordered sequence of interactions. It is particularly useful for showing how a specific request travels through the system layers.
🔍 Key Components
To understand the diagram, one must recognize its fundamental building blocks:
- Lifelines: Represent participating objects, actors, or system components. They are depicted as vertical dashed lines.
- Messages: Represented by horizontal arrows, indicating a signal sent from one object to another. These include synchronous calls, asynchronous signals, and return messages.
- Activation Bars: Rectangles placed on lifelines showing when an object is actively performing an operation.
- Combined Fragments: Boxes that denote specific interaction behaviors like loops, options, or parallel processing.
✅ When to Use Sequence Diagrams
Sequence diagrams excel in scenarios where the order of events is critical. They are ideal for:
- API Design: Visualizing the request-response cycle between a client and a server.
- Data Flow: Tracking how data transforms as it moves through different service layers.
- State Transitions: Showing how an object changes state in response to specific triggers.
- Debugging Logic: Identifying where a specific error occurs in a message chain.
⚠️ Limitations
Despite their utility, sequence diagrams have constraints:
- Complexity: As the number of objects and messages increases, the diagram can become a tangled web that is hard to read.
- Control Flow: They struggle to represent complex decision trees, loops, or branching logic without becoming cluttered.
- Abstraction: They often get too granular, making it difficult to see the high-level flow of a process.
🧭 The Interaction Overview Diagram Deep Dive
The Interaction Overview Diagram is a hybrid model. It combines the high-level control flow of an Activity Diagram with the detailed interaction logic of a Sequence Diagram. It provides a macro view of the process while allowing you to drill down into specific interactions.
🔍 Key Components
This diagram uses nodes and control flow to structure the interaction:
- Initial Node: A solid circle indicating where the process begins.
- Control Flow Nodes: Rounded rectangles representing actions or steps in the process.
- Interaction Nodes: Specific nodes that reference an entire Sequence Diagram or Communication Diagram.
- Decision Nodes: Diamond shapes representing conditional logic (e.g., if/else branches).
- Object Nodes: Represent data flowing between steps.
- Final Node: A circle with a dot indicating the end of the process.
✅ When to Use Interaction Overview Diagrams
Use this model when you need to orchestrate complex processes:
- Complex Workflows: Handling multi-step processes with conditional branches, such as payment processing or order fulfillment.
- High-Level Architecture: Showing how different subsystems interact without detailing every single message.
- Nested Logic: When a specific sequence is repeated or depends on the outcome of another sequence.
- System Integration: Mapping the interaction between microservices where one service triggers another based on conditions.
⚠️ Limitations
There are trade-offs to consider:
- Abstraction Level: Too much abstraction can hide critical details needed for implementation.
- Readability: For developers used to linear message flows, the flow control nodes can be confusing.
- Tooling: Not all modeling tools support Interaction Overview diagrams as robustly as Sequence diagrams.
📊 Side-by-Side Comparison
To clarify the distinctions, here is a structured comparison of the two models.
| Feature | Sequence Diagram | Interaction Overview Diagram |
|---|---|---|
| Primary Focus | Time-ordered message flow | Control flow and high-level logic |
| Complexity Handling | Best for linear or simple branching | Best for complex branching and loops |
| Detail Level | High detail (specific messages) | Mixed (nodes reference sequences) |
| Decision Logic | Uses combined fragments (alt/opt) | Uses decision nodes and flows |
| Audience | Developers, QA Engineers | Architects, Stakeholders, Leads |
| Visual Clarity | Can clutter with too many actors | Can obscure detail if overused |
| Modification | Hard to change order mid-process | Easy to rewire control flow |
🏗️ Decision Framework for Full-Stack Teams
Choosing the right model depends on the specific context of your project. Here is a breakdown of how to apply these diagrams across different layers of a full-stack architecture.
🔹 Backend Logic
For backend services, the Sequence Diagram is often preferred for specific API endpoints. When a user requests data, the backend needs to know exactly which database calls to make and in what order. However, if the backend service orchestrates multiple microservices (e.g., checking inventory, calculating tax, and charging a payment), an Interaction Overview Diagram is better suited to show the conditional logic of the orchestration.
🔹 Frontend State Management
Frontend interactions often involve complex state transitions. A Sequence Diagram can show how a UI component requests data from an API. However, if the frontend handles a multi-step wizard where user input determines the next step, an Interaction Overview Diagram can map the decision points without cluttering the UI logic.
🔹 Integration Points
When integrating third-party services, clarity is paramount. If the integration is a simple callback, a Sequence Diagram suffices. If the integration involves retry logic, error handling paths, and fallback mechanisms, the Interaction Overview Diagram provides a safer map for the team to follow.
🔗 Integrating Both Models for Clarity
These diagrams are not mutually exclusive. In fact, they work best when used together. A common pattern is to create an Interaction Overview Diagram to represent the high-level process, and then nest Sequence Diagrams within specific nodes of the overview.
This approach offers several benefits:
- Modularity: You keep the high-level view clean while maintaining detailed documentation for complex sections.
- Reusability: A single Sequence Diagram can be referenced by multiple nodes in an Overview Diagram.
- Scalability: As the system grows, you can update specific sequence details without redrawing the entire architecture.
For example, in an e-commerce application, the Interaction Overview Diagram might show the checkout process. One of the nodes could be labeled “Payment Processing.” Inside that node, you would reference a detailed Sequence Diagram showing the communication between the payment gateway, the bank, and the internal ledger service.
🔄 Maintenance and Evolution
Documentation in software development is often neglected because it becomes outdated quickly. To maintain the value of your UML diagrams, you must adopt strategies for keeping them current.
- Version Control: Treat diagrams as code. Store them in your version control system alongside your source code.
- Automated Generation: Where possible, generate Sequence Diagrams from actual code or logs to ensure accuracy.
- Regular Reviews: Include diagram updates in your code review process. If the code changes, the diagram should reflect that change.
- Minimalist Approach: Do not document every single method call. Focus on the critical paths and the interactions that define system behavior.
⚠️ Common Pitfalls to Avoid
Even experienced architects can make mistakes when modeling interactions. Here are common errors to watch out for.
🔸 Over-Engineering
Do not create diagrams for simple scripts or trivial flows. If a function takes less than five lines of code, a diagram adds unnecessary overhead. Reserve modeling for complex business logic.
🔸 Ignoring Error Paths
Many diagrams only show the “Happy Path” where everything works perfectly. A robust model must include error handling, timeouts, and fallback mechanisms. Missing these paths can lead to production failures that were not anticipated during design.
🔸 Inconsistent Notation
Ensure your team agrees on the notation standards. Use standard UML shapes and avoid custom icons unless they are well-documented. Inconsistency confuses readers and reduces the diagram’s effectiveness.
🔸 Mixing Concerns
Do not mix structural and behavioral diagrams. A Sequence Diagram should focus on interaction, not on class inheritance. Keep the concerns separated to maintain clarity.
📝 Best Practices for Documentation
To ensure your UML models serve their purpose effectively, adhere to these best practices.
- Start with the Overview: Begin with the Interaction Overview Diagram to define the boundaries of the system.
- Drill Down: Create Sequence Diagrams only for the nodes that require detailed message flow explanation.
- Label Clearly: Use descriptive names for messages, objects, and nodes. Avoid generic terms like “Process 1” or “Call”.
- Define Scope: Clearly state what is included and what is outside the scope of the diagram.
- Collaborate: Involve developers and stakeholders in the creation of the diagrams. This ensures the model reflects reality and gains team buy-in.
💡 Summary of Strategic Choices
Selecting between a Sequence Diagram and an Interaction Overview Diagram is a strategic decision. It depends on the complexity of your system, the maturity of your team, and the specific communication goals you have.
If your priority is understanding the exact timing and order of messages between specific components, the Sequence Diagram is the tool to use. It provides the granularity needed for implementation and debugging.
If your priority is understanding the overall flow, decision points, and how different processes fit together, the Interaction Overview Diagram is the superior choice. It provides the abstraction needed for architectural planning and stakeholder communication.
By leveraging both models appropriately, you can create a documentation strategy that supports both high-level vision and low-level execution. This balance ensures that your full-stack projects remain scalable, maintainable, and clear throughout their lifecycle.