


Designing secure and efficient authentication systems requires more than just writing code. It demands a clear understanding of how data moves between users, servers, and databases. For many developers and architects, the complexity of a login process can become obscured by implementation details. This is where visual modeling becomes essential. Specifically, the UML Interaction Overview Diagram offers a high-level view that bridges the gap between abstract requirements and concrete logic.
This guide provides a structured approach to modeling a complete user login flow. We will focus on clarity, logical progression, and standard notation without relying on specific proprietary tools. By the end of this tutorial, you will understand how to map out entry points, decision nodes, and final states within an authentication context.
🔍 Understanding the Interaction Overview Diagram
Before constructing the diagram, it is vital to define what an Interaction Overview Diagram (IOD) is and how it differs from other UML notations. While a Sequence Diagram excels at showing the timing of messages between objects, an Interaction Overview Diagram focuses on the control flow of interactions.
- High-Level View: It aggregates multiple interactions into a single flowchart-like structure.
- Control Flow: It utilizes standard flowchart symbols to represent logic branches, loops, and merges.
- Combination: It can embed activity diagrams or sequence diagrams within its nodes to show detailed behavior.
For a login system, the IOD is particularly useful because authentication involves conditional logic. A user might enter the wrong password, an account might be locked, or a session token might expire. The IOD allows you to visualize these paths simultaneously rather than tracing them through a linear sequence of messages.
🔐 Why Use IOD for Authentication Flows?
Authentication is rarely a straight line. It involves validation, external service calls, and error recovery. Using an Interaction Overview Diagram for this purpose provides several distinct advantages:
- Clarity in Logic: Decision diamonds clearly separate success paths from failure paths.
- Scope Definition: It helps define the boundaries of the login module, showing where it starts and where it hands off control.
- Stakeholder Communication: Business analysts and project managers can read the diagram without needing to understand the underlying code syntax.
- Testing Coverage: Every branch in the diagram represents a test case. If a node exists in the diagram, it must be covered in the test suite.
📝 Pre-Design Considerations
Before drawing the first symbol, you must define the scope and the actors involved. A login flow is not just about a username and password; it encompasses security protocols and state management.
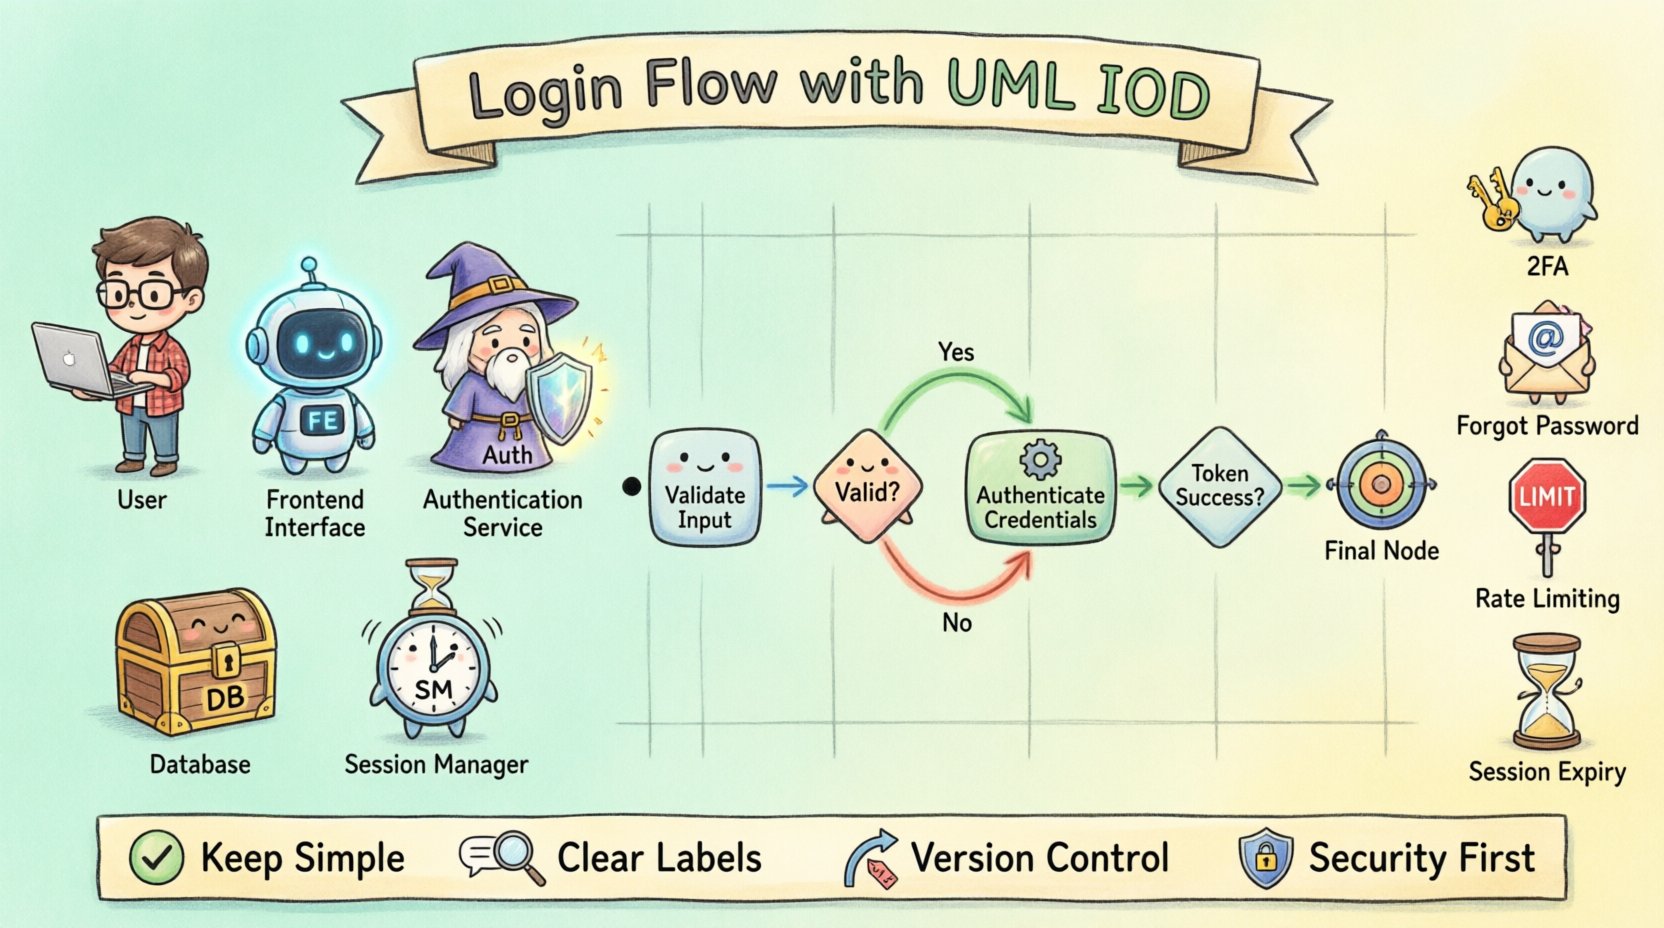
Key Actors
- User: The individual initiating the request.
- Frontend Interface: The client application receiving input.
- Authentication Service: The backend logic verifying credentials.
- Database: The storage system holding user records.
- Session Manager: The component responsible for creating tokens.
Data Requirements
Ensure you know what data is being exchanged. Typical data points include:
- Credentials: Username or Email, Password.
- Metadata: IP Address, User Agent, Timestamp.
- Tokens: JWTs, Session IDs, Refresh Tokens.
- Status Codes: Success (200), Unauthorized (401), Forbidden (403).
🏗️ Step-by-Step Construction of the Diagram
Now we move to the core task. We will build the diagram logically, moving from the entry point to the final outcome. Each step below represents a distinct section of your diagram.
Step 1: Defining the Entry Point
Every interaction begins somewhere. In a login flow, this is typically a form submission on a client device.
- Symbol: Initial Node (Solid Black Circle).
- Action: User enters credentials and submits the form.
- Flow: An arrow leads from the Initial Node to the Input Validation Action.
Step 2: Input Validation Logic
Before sending data to a server, the client must ensure the data is valid. This reduces unnecessary network traffic and improves user experience.
- Symbol: Activity Node (Rounded Rectangle).
- Actions: Check for empty fields, validate email format, check password length.
- Decision: A diamond shape follows this action. It asks, “Is Input Valid?”
- Paths:
- Yes: Proceed to Authentication Request.
- No: Proceed to Error Display.
Step 3: Authentication Service Interaction
This is the core logic. The system must verify the credentials against stored data.
- Symbol: Call Behavior Action Node (often represented as a rectangle with a specific icon or simply a labeled activity).
- Context: This node encapsulates a deeper sequence diagram or activity logic.
- Process:
- Query Database for user record.
- Hash the provided password.
- Compare hashes securely.
Step 4: Session Management
Once credentials are verified, the system must establish a session.
- Symbol: Activity Node.
- Actions: Generate Token, Set Cookie, Update Last Login Timestamp.
- Decision: “Token Generation Successful?”
- Paths:
- Yes: Redirect to Dashboard.
- No: Log Error and Return to Login.
Step 5: Handling Exceptions and Final States
Not every login attempt succeeds. You must model the failure paths to ensure they are handled gracefully.
- Invalid Credentials: Return a generic error message (do not reveal if the username exists).
- Account Locked: Trigger a cooldown period or send a lockout alert.
- Network Failure: Retry logic or connection timeout display.
- Symbol: Final Node (Solid Black Circle with a Border).
🎨 Visual Elements Reference
To ensure your diagram is readable and follows standard UML conventions, use the following symbols consistently. This table summarizes the key components used in the login flow.
| Symbol Name | Visual Representation | Function in Login Flow |
|---|---|---|
| Initial Node | ⚫ Solid Black Circle | Starts the process upon form submission. |
| Activity Node | ⬜ Rounded Rectangle | Represents an action like validating input or hashing a password. |
| Decision Node | ⬡ Diamond Shape | Branches logic based on conditions (e.g., Password Match). |
| Call Behavior Node | ⬜ Rectangle with Icon | Invokes a sub-process, such as checking the database. |
| Control Flow Arrow | ➡️ Directed Line | Shows the order of operations between nodes. |
| Final Node | ⬛ Solid Black Circle with Border | Ends the interaction successfully or via error. |
🛡️ Common Patterns in Authentication
Authentication flows often share common patterns across different applications. Recognizing these patterns helps in standardizing your diagrams and reducing design time.
| Pattern | Description | Diagram Node Logic |
|---|---|---|
| Basic Auth | Username and Password verification. | Single decision node after credential check. |
| Two-Factor Auth (2FA) | Requires a second verification step. | Insert a new decision node after successful password check requesting the code. |
| Forgot Password | Recovery flow via email link. | Branch from the login failure node leading to a reset token generation action. |
| Rate Limiting | Restricts failed attempts. | Check node before authentication to see if the IP/User is blocked. |
| Session Expiry | Forces re-authentication. | Check node before accessing protected resources. |
🚀 Best Practices for Documentation
Creating the diagram is only half the battle. Maintaining it and ensuring it remains useful requires discipline. Follow these guidelines to keep your documentation effective.
- Keep it Simple: Avoid cluttering the diagram with every single error code. Group similar errors into a single “Handle Failure” action node.
- Use Clear Labels: Decision diamonds should be labeled with questions (e.g., “Is User Valid?”) rather than states (e.g., “True/False”).
- Consistent Notation: Stick to the standard UML symbols. Do not invent new shapes for standard actions.
- Version Control: Treat your diagrams as code. Update them whenever the login logic changes. A diagram that does not match the code is worse than no diagram at all.
- Group Related Flows: If the diagram becomes too large, use Call Behavior nodes to break the flow into sub-diagrams (e.g., “Password Reset Flow”, “Login Flow”, “2FA Flow”).
- Focus on Control: Do not try to show every data payload in an Interaction Overview Diagram. That is the job of a Sequence Diagram. Focus on the flow of control and decision points.
🧩 Handling Security Edge Cases
Security is the primary concern in login systems. Your diagram must account for security threats and defensive measures.
1. Brute Force Protection
Include a node that tracks failed attempts. If the count exceeds a threshold, trigger a “Lock Account” action. This should be a decision node that loops back to the login form if the account is locked.
2. Secure Token Transmission
When modeling the session token generation, ensure the flow indicates that the token is sent via a secure channel (e.g., HTTPS). While the diagram does not show the protocol, the action node should be labeled “Generate Secure Token” to imply this constraint.
3. CSRF Protection
Before the authentication service is called, add a node for “Verify CSRF Token”. If this check fails, the flow should terminate immediately with an error state, preventing the main authentication logic from running.
4. Session Timeout
Include a path for users who remain inactive. A separate flow (often linked via a timer event) should handle the “Logout on Timeout” action, clearing the session data and returning the user to the entry point.
📈 Reviewing and Validating the Diagram
Once the diagram is complete, perform a validation step to ensure logical consistency.
- Reachability: Can every node be reached from the Initial Node?
- Liveness: Can the process terminate from any active node? (Ensure no infinite loops exist without exit conditions).
- Completeness: Does every Decision Node have outgoing paths for all possible outcomes?
- Clarity: Is the flow easy to follow from left to right or top to bottom?
Invite a colleague to review the diagram without explaining it to you. If they can trace the login process and identify the error paths without assistance, the diagram has achieved its purpose.
🔄 Integrating with Other Models
An Interaction Overview Diagram rarely exists in isolation. It is part of a larger modeling ecosystem.
- Use Case Diagram: Defines the high-level goals (e.g., “User Logs In”). The IOD shows how that goal is achieved.
- Sequence Diagram: Details the specific message exchanges between the Frontend and Backend. The IOD can embed a reference to this sequence.
- State Machine Diagram: Useful for modeling the session state (Logged In, Logged Out, Locked, Expired). The IOD can reference these states during transitions.
📝 Final Considerations
Building a login flow diagram is an exercise in logic and communication. It forces you to think about every possible path a user might take, from the successful entry to the various failure states. By using the Interaction Overview Diagram, you create a blueprint that is accessible to technical and non-technical team members alike.
Remember that the goal of modeling is not to produce a perfect artifact, but to reduce ambiguity. A well-documented flow prevents misunderstandings during development and testing. As your system evolves, the diagram should evolve with it. Regular updates ensure that the visual representation remains a trusted source of truth for your architecture.
Start with the entry point, map the decisions, and define the exits. With practice, constructing these diagrams will become a natural part of your design process, providing clarity and confidence in your system’s reliability.