


Modeling software architecture requires precision. Among the various Unified Modeling Language (UML) diagram types, the Interaction Overview Diagram (IOD) occupies a unique space. It bridges the gap between high-level control flow and detailed object interactions. Many development teams encounter scenarios where standard sequence diagrams become too cluttered, or activity diagrams lack the necessary context of object lifecycles. This guide addresses the most common questions regarding the Interaction Overview Diagram, providing clear guidance on application, notation, and strategic use cases.
📌 What Exactly Is an Interaction Overview Diagram?
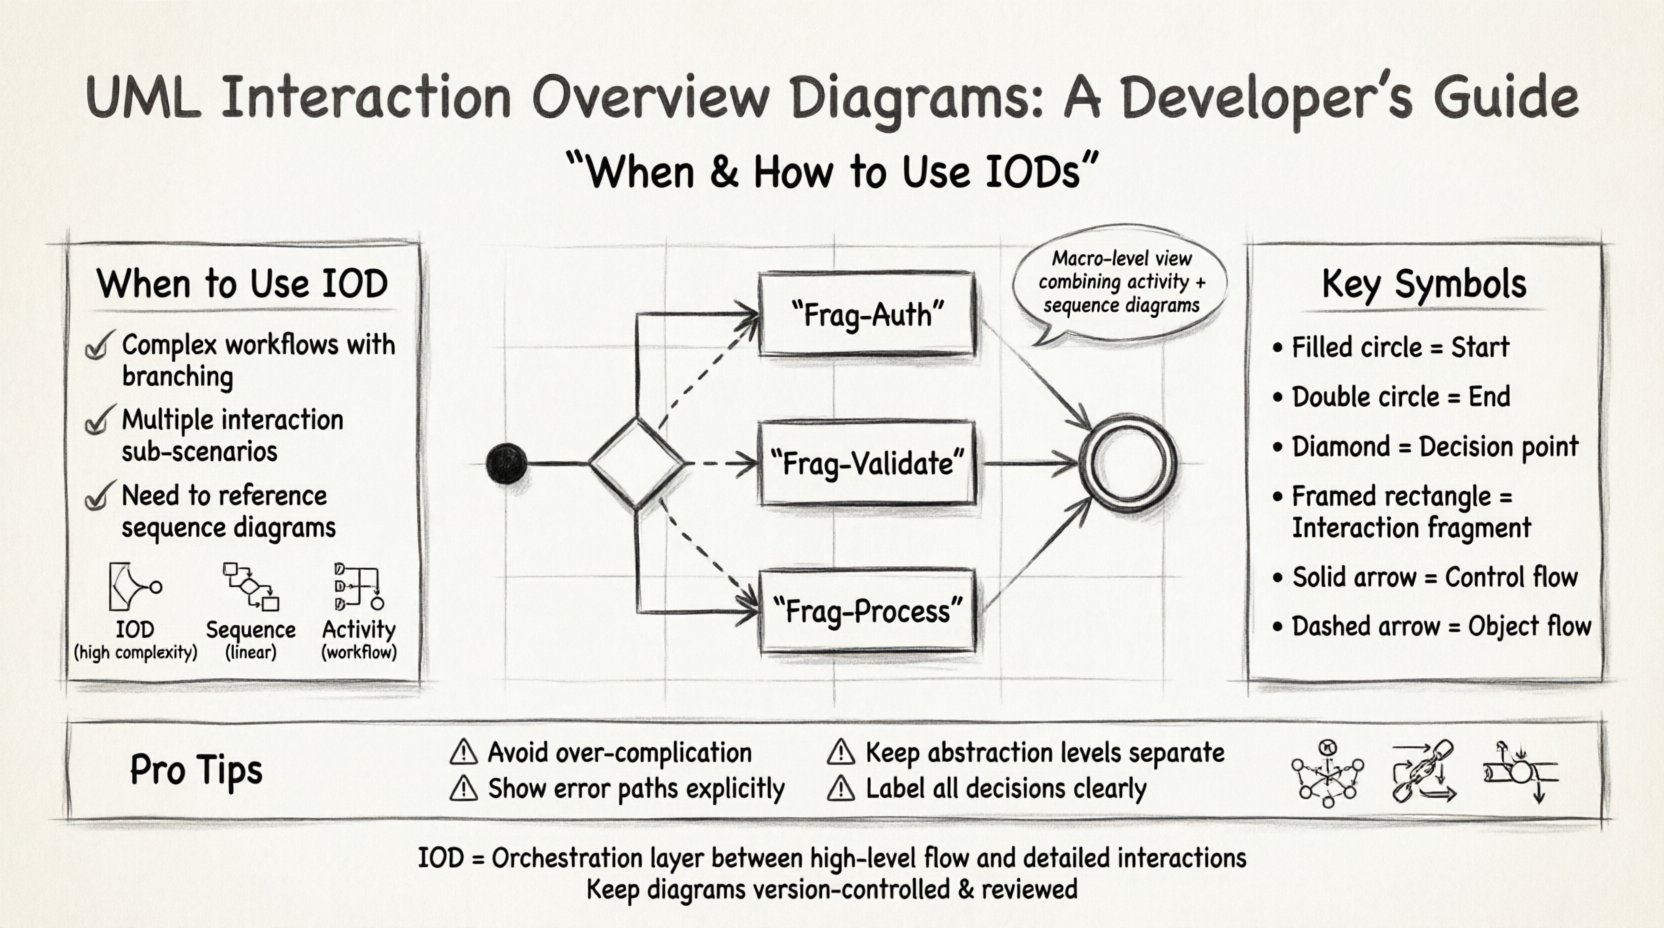
An Interaction Overview Diagram is a type of activity diagram that combines the control flow capabilities of activity diagrams with the interaction capabilities of sequence diagrams. It serves as a macro-level view of a system’s behavior. Instead of showing every single message exchange between objects in a linear fashion, it breaks down a complex process into distinct interaction fragments.
Think of it as a table of contents for your system’s logic. Each node in the overview represents a specific interaction scenario. This allows architects to manage complexity without losing the detail required for implementation. It is particularly useful for systems where control flow is as important as the data flow.
- Macro View: It provides a high-level overview of a use case or operation.
- Control Flow: It defines the order in which different interaction scenarios occur.
- Reusability: It references existing interaction fragments, reducing redundancy.
🔍 When Should You Use This Diagram Type?
Choosing the right modeling tool is critical for effective communication. Developers often confuse the Interaction Overview Diagram with standard Activity Diagrams or Sequence Diagrams. The decision to use an IOD should depend on the complexity of the control flow and the need to reference specific object interactions.
Comparison: IOD vs. Sequence Diagram vs. Activity Diagram
| Feature | Interaction Overview Diagram | Sequence Diagram | Activity Diagram |
|---|---|---|---|
| Primary Focus | Control flow of interactions | Object-to-object message flow | Workflow and business logic |
| Complexity Handling | High (via fragments) | Low (linear view) | Medium (flow control) |
| Object Lifecycles | Visible within fragments | Central to the diagram | Not emphasized |
| Best Used For | Complex workflows with sub-scenarios | Specific message exchanges | Algorithmic logic |
If your system involves a process that branches significantly based on conditions, or if a single use case requires multiple distinct interaction patterns, an IOD is the appropriate choice. For instance, a payment processing flow that might involve fraud detection, bank verification, or direct charge requires different interaction sequences. An IOD can show the decision path between these sequences without drawing three separate sequence diagrams on one page.
🛠️ How Do You Construct One Effectively?
Building an Interaction Overview Diagram is a systematic process. It requires understanding the control flow of the system and identifying logical break points where interactions occur. Follow this structured approach to ensure clarity and maintainability.
Step 1: Define the Scope
Identify the specific use case or operation you are modeling. Do not attempt to model the entire system in one diagram. Scope it to a single feature, such as “User Login” or “Order Fulfillment”.
Step 2: Identify Interaction Fragments
Break down the operation into smaller chunks. Each chunk should represent a distinct interaction scenario. For example, in a login system, you might have fragments for “Credential Validation”, “Session Creation”, and “Error Handling”.
Step 3: Arrange Control Flow
Connect these fragments using control flow arrows. Decide on the entry and exit points for each fragment. Use decision nodes to represent conditions that determine which interaction fragment is executed next.
Step 4: Refine Notation
Ensure all symbols adhere to UML standards. Use frames to distinguish interaction fragments from regular activities. Label all decision nodes clearly to avoid ambiguity during code review.
- Initial Node: The starting point of the interaction.
- Final Node: The successful or unsuccessful end point.
- Decision Node: A diamond shape indicating a branching path.
- Interaction Node: A rectangle representing a sequence diagram fragment.
🧩 What Are the Standard Symbols and Notation?
Consistency in notation is vital for team collaboration. If team members interpret symbols differently, the diagram becomes a source of confusion rather than a tool for understanding. The Interaction Overview Diagram borrows heavily from Activity Diagrams but integrates elements from Interaction Diagrams.
Core Symbols Explained
- Initial Node (Filled Circle): Marks where the process begins. There should be exactly one entry point per diagram.
- Final Node (Double Circle): Marks where the process ends. This can appear in multiple locations if there are multiple termination states.
- Decision Node (Diamond): Represents a condition. Input flows must be labeled to indicate which condition leads to which output.
- Interaction Use (Rectangle with Frame): This is the core of the IOD. It encapsulates a sequence diagram or communication diagram. It acts as a node within the activity flow.
- Control Flow (Arrow): Indicates the sequence of execution. Unlike object flow, this represents the control of the process itself.
- Object Flow (Dashed Arrow): Represents the flow of data or objects between activities, not just control.
🔄 How Do You Handle Loops and Iterations?
Complex systems rarely follow a linear path. Loops are common in data processing, polling mechanisms, and retry logic. The Interaction Overview Diagram handles these through specific control structures.
When modeling a loop, such as a retry mechanism for a failed network request, you use a decision node. If the request fails, the control flow loops back to the interaction fragment representing the retry. If it succeeds, the flow continues to the next step.
Consider the following patterns:
- Count-Based Loops: Iterate a specific number of times, such as processing a batch of 100 records.
- Condition-Based Loops: Continue until a specific state is reached, such as waiting for a database lock to release.
- Event-Based Loops: Wait for an external signal, often seen in event-driven architectures.
Visualizing these loops clearly prevents developers from implementing infinite loops or missing edge cases during the coding phase. The diagram acts as a contract for the logic.
⚠️ What Are Common Mistakes to Avoid?
Even experienced architects can fall into traps when modeling complex interactions. Recognizing these pitfalls early saves significant time during implementation.
1. Over-Complication
Do not try to model every edge case in a single diagram. If the diagram becomes unreadable, it has failed its purpose. Split the logic into multiple diagrams or use sub-fragments to simplify the view.
2. Ignoring Error Paths
Many diagrams focus only on the happy path. An Interaction Overview Diagram must explicitly show failure modes. If a service call fails, where does the flow go? Is there a fallback? This is critical for robust system design.
3. Mixing Levels of Abstraction
Do not mix high-level business logic with low-level technical details in the same fragment. Keep the interaction fragments focused on the specific interaction, and keep the overview focused on the orchestration.
4. Unclear Decision Labels
A decision node without clear labels is useless. Every outgoing path from a diamond must have a boolean condition or a clear state label (e.g., “Success”, “Timeout”, “Error”).
🔗 How Does It Integrate With Other UML Diagrams?
An Interaction Overview Diagram does not exist in isolation. It is part of a larger ecosystem of UML models. Understanding how it relates to other diagrams ensures a cohesive documentation strategy.
Relationship with Sequence Diagrams
Sequence diagrams provide the micro-view. The IOD references them. When you create an interaction fragment in the IOD, you should have a corresponding sequence diagram that details the messages within that fragment. This separation of concerns keeps the overview clean while preserving detail where needed.
Relationship with Class Diagrams
The objects involved in the interaction fragments must exist in your Class Diagram. Ensure that the lifelines in your referenced sequence diagrams match the classes defined in your static structure. This alignment prevents discrepancies between design and implementation.
Relationship with State Machine Diagrams
State machine diagrams describe the lifecycle of an object. The IOD describes the flow of interactions between objects. They complement each other. Use state machines to define the internal logic of a single object and the IOD to define the workflow between them.
🏗️ Best Practices for Maintenance and Documentation
Diagrams are living documents. As the system evolves, the diagrams must evolve with it. Neglecting updates leads to documentation debt and confusion.
- Version Control: Treat diagrams as code. Store them in version control systems alongside your source code.
- Review Cycles: Include diagram updates in your code review process. If the logic changes, the diagram must change.
- Standardization: Adopt a naming convention for fragments. Use prefixes like “Frag-” to distinguish them from regular activities.
- Tooling Consistency: Use the same modeling tool across the team to ensure compatibility and shared templates.
🧠 Understanding Control Flow vs. Object Flow
A nuanced understanding of flow types is essential for accurate modeling. Confusing these two can lead to logical errors in the system design.
Control Flow dictates the order of execution. It determines what happens next. It is the backbone of the process. Arrows representing control flow do not carry data; they carry the authority to proceed.
Object Flow dictates the movement of data. It shows which objects are consumed or produced at each step. This is crucial for understanding dependencies and resource management.
| Aspect | Control Flow | Object Flow |
|---|---|---|
| Visual Representation | Solid Line with Arrow | Dashed Line with Arrow |
| Purpose | Sequence of Actions | Transfer of Data |
| Example | Move to next step | Pass User Object to Service |
🚀 Real-World Application Scenarios
To truly grasp the utility of this diagram, consider specific industry scenarios where it shines.
Scenario 1: Microservices Orchestration
In a microservices architecture, a single user request often triggers multiple backend services. An IOD can map the sequence of service calls, including retries and fallbacks. It clarifies which service is responsible for which part of the request flow without getting bogged down in the internal logic of each service.
Scenario 2: Payment Gateway Integration
Payments involve multiple steps: validation, authorization, capture, and settlement. Errors can occur at any stage. An IOD allows you to map the success and failure paths clearly. For example, if authorization fails, does the system void the transaction or hold it? The diagram provides the logic for the recovery workflow.
Scenario 3: Data Pipeline Processing
ETL (Extract, Transform, Load) processes often involve branching logic based on data quality. If data is invalid, it might go to a quarantine queue. If valid, it proceeds to transformation. An IOD visualizes these branching paths effectively, ensuring data integrity checks are documented.
📝 Summary of Key Takeaways
Understanding when and how to apply the Interaction Overview Diagram is a skill that improves over time. It is not a replacement for other diagrams but a complement that adds a layer of orchestration visibility.
- Complexity Management: Use it when sequence diagrams become too fragmented.
- Control Visibility: Use it to show the logic of decision-making between interactions.
- Documentation: Use it to provide a high-level map for developers and stakeholders.
- Clarity: Keep it clean. Avoid cluttering it with details that belong in sequence diagrams.
By adhering to standard notation and focusing on the flow of control rather than just data, you create diagrams that serve as reliable blueprints for development. This approach reduces ambiguity and aligns the team on the intended behavior of the system.