


When modeling complex software systems, visualizing the flow of control is as critical as defining the data structures themselves. The Unified Modeling Language (UML) offers several diagram types, but few bridge the gap between high-level logic and detailed interaction as effectively as the Interaction Overview Diagram (IOD). This specific diagram type combines elements of activity diagrams and interaction diagrams to provide a macroscopic view of system behavior. Understanding the mechanics of entry points, exits, and nested flows allows architects to design systems that are robust, maintainable, and logically sound.
In this guide, we explore the structural components of the Interaction Overview Diagram. We move beyond basic definitions to examine how control flows through a system, how nested activities manage complexity, and how to identify logical dead ends before implementation begins. This technical overview is designed for software architects, system designers, and developers who require precision in their architectural documentation.
What is an Interaction Overview Diagram? 📊
An Interaction Overview Diagram is a specialized form of activity diagram that shows the flow of control and data between interactions. While a standard activity diagram focuses on the internal logic of a single process, an IOD focuses on the sequence of interactions between different system components. It acts as a map for the system’s behavior, highlighting where one interaction ends and another begins.
The diagram is particularly useful for complex architectures where multiple sequences of events must be coordinated. Unlike a Sequence Diagram, which details the timeline of messages between objects in a single scenario, an IOD provides a broader perspective. It allows you to see how different interaction scenarios are stitched together to form a complete workflow.
Key characteristics include:
- Control Flow Focus: It emphasizes the order in which operations occur rather than the precise timing of individual messages.
- Modularity: It can encapsulate complex sequences into single nodes, allowing for a cleaner top-level view.
- Decision Logic: It incorporates decision nodes to show branching paths based on conditions.
- Integration: It serves as a bridge between static structure and dynamic behavior.
Anatomy of the Interaction Overview Diagram 🔗
To build a reliable model, one must understand the specific symbols and their semantic meanings. Each element in an IOD represents a specific state or action within the system lifecycle.
1. Activity Nodes
Activity nodes represent the actions or operations being performed. In an IOD, these nodes often encapsulate entire interaction sequences. Instead of drawing every single message exchange, you might draw a single rounded rectangle representing a complex service call.
- Call Behavior Action Node: This indicates that a specific behavior or operation is being invoked. It is the primary workhorse of the diagram.
- Input/Output Flows: These nodes manage the data passing in and out of the activity, ensuring that prerequisites are met before execution.
2. Control Flows
Control flows dictate the order of execution. An arrow pointing from one node to another indicates that the source node must complete before the target node begins. This is distinct from object flows, which represent data movement.
- Sequential Execution: Standard arrows show a linear progression of tasks.
- Fork and Join: These nodes allow for parallel processing. A fork splits a single flow into multiple concurrent threads, while a join waits for all threads to complete before proceeding.
3. Decision and Merge Nodes
Real-world systems rarely follow a single linear path. Decision nodes introduce logic that directs the flow based on conditions.
- Decision Node: A diamond shape with multiple outgoing flows. Only one path is taken based on the evaluation of a guard condition.
- Merge Node: A diamond shape with multiple incoming flows and a single outgoing flow. It consolidates different paths back into a single stream of control.
Understanding Entry Points 🚪
The entry point is where the control flow enters the Interaction Overview Diagram. Identifying the correct starting state is fundamental to ensuring the model is executable. An incorrect entry point can lead to logical inconsistencies in the design.
The Initial Node
Every Interaction Overview Diagram must have exactly one initial node. This is represented by a filled black circle. It marks the absolute beginning of the workflow. All other flows must eventually trace back to a path that originates from this node.
- Uniqueness: There should be only one initial node. Multiple entry points create ambiguity about where the process truly starts.
- Accessibility: The initial node must be reachable from the start of the system trigger. If a user action initiates the process, the diagram must reflect that trigger at the initial node.
Entry Conditions
Before the initial node becomes active, certain preconditions must be met. These are often modeled using guard conditions on the first control flow. For example, a system might only begin processing a transaction if the user is authenticated.
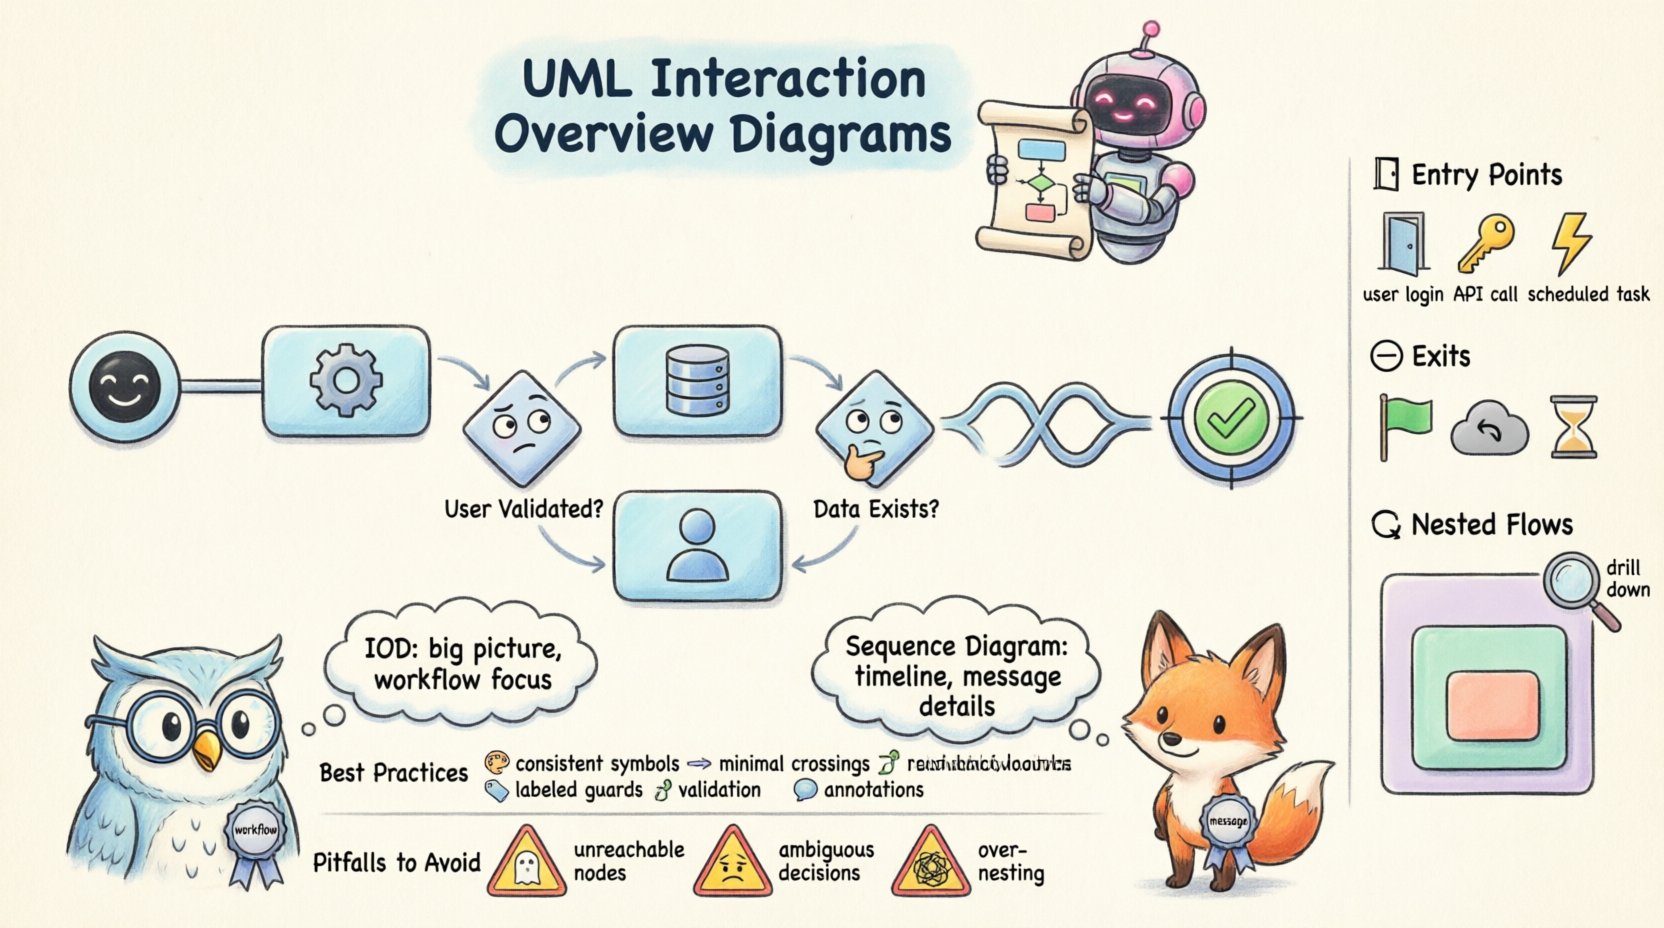
Common entry scenarios include:
- User Initiation: A login event triggers the workflow.
- System Event: A scheduled task or a database change initiates the process.
- External Trigger: An API request from a third-party service starts the flow.
Mastering Exits and Termination ⏹️
Just as important as knowing where a process starts is knowing where it ends. Exits define the termination points of the Interaction Overview Diagram. Properly defined exits ensure that resources are released and the system state is consistent.
Final Activity Node
The final activity node is represented by a black circle surrounded by a ring. It signifies the successful completion of the workflow. Unlike the initial node, there can be multiple final activity nodes in a single diagram, representing different successful outcomes.
- Successful Completion: Indicates the primary goal of the interaction has been achieved.
- State Cleanup: This node implies that any temporary resources allocated during the flow are being finalized.
Exception Handling and Failed Exits
Not every process ends successfully. A robust architecture accounts for failure modes. While standard UML does not have a specific “failed exit” node, architects often use additional final activity nodes to represent error states or rollback points.
Consider the following exit scenarios:
- Normal Termination: The process completes as expected.
- Exception Termination: An error occurs, and the system halts or rolls back.
- Timeout Termination: The process exceeds a time limit and is terminated automatically.
Nested Flows and Sub-Activities 🔄
Complex architectures often require abstraction. You cannot draw every single interaction in a single diagram without making it unreadable. Nested flows allow you to encapsulate complex logic within a single activity node.
Call Behavior Action Nodes
When an activity node represents a complex interaction, it can be “drilled down” into a separate diagram. This is done using a Call Behavior Action Node. It acts as a placeholder for another Interaction Overview Diagram or an Activity Diagram.
- Abstraction: Keeps the high-level diagram clean by hiding implementation details.
- Reusability: The same nested behavior can be called from multiple places in the main diagram.
- Scope Management: Defines the boundaries of specific subsystems.
Object Partitions
Within nested flows, you may need to specify which component is responsible for a specific action. Object partitions (often called swimlanes) help clarify responsibility.
- Responsibility Assignment: Clearly indicates which actor or system component performs the action.
- Interaction Context: Helps visualize data ownership during the flow.
Managing Complexity
Nesting too deeply can lead to “spaghetti models” where tracing the flow becomes difficult. To maintain clarity:
- Limit Nesting Depth: Try not to nest more than three levels deep.
- Clear Interfaces: Define clear input and output parameters for every nested activity.
- Documentation: Add notes to nested nodes explaining what the sub-diagram contains.
Interaction Overview vs. Sequence Diagrams 🆚
Selecting the right diagram type is crucial for effective communication. While both diagrams deal with interactions, they serve different purposes.
| Feature | Interaction Overview Diagram | Sequence Diagram |
|---|---|---|
| Focus | Flow of control and overall workflow | Message exchange and timing |
| Scope | High-level, multi-scenario | Single scenario, detailed |
| Complexity | Handles branching and loops well | Handles timing and order well |
| Usage | Architectural planning | Implementation details |
When to Use an Interaction Overview Diagram
Use an IOD when you need to visualize the orchestration of multiple interactions. It is ideal for:
- Designing business process workflows.
- Defining error handling strategies across multiple services.
- Documenting the logic flow for complex transactions.
- Providing a high-level view for stakeholders who do not need message-level details.
When to Use a Sequence Diagram
Use a Sequence Diagram when timing and message order are critical. It is ideal for:
- Debugging specific interaction issues.
- Documenting API contracts.
- Visualizing synchronous vs. asynchronous calls.
- Designing the internal logic of a single method or function.
Best Practices for Modeling Complex Flows 🛠️
Creating a diagram is one thing; creating a useful one is another. Adhering to best practices ensures that the model remains maintainable and understandable over time.
1. Maintain Consistency in Symbols
Ensure that every node type is used consistently throughout the diagram. Do not mix activity nodes with object nodes unless there is a clear semantic reason. Consistency reduces cognitive load for anyone reading the model.
2. Minimize Crossing Lines
Control flows that cross each other excessively make the diagram difficult to trace. Arrange nodes logically to minimize line crossings. Use orthogonal edges (lines that turn at 90-degree angles) to improve readability.
3. Document Guard Conditions
Every decision node should have clearly labeled guard conditions. Avoid generic labels like “True” or “False.” Instead, use specific conditions such as “User Validated” or “Data Exists.”
4. Validate Reachability
Ensure that every node is reachable from the initial node. Dead ends that are not final activity nodes represent logic errors. Similarly, ensure that every node can eventually reach a final activity node to prevent infinite loops.
5. Use Annotations
Complex logic often requires explanation. Use notes and annotations to clarify why certain paths exist or to specify constraints that cannot be represented graphically.
Common Pitfalls and How to Avoid Them ⚠️
Even experienced architects encounter issues when modeling complex systems. Being aware of common mistakes helps in designing more reliable diagrams.
1. Unreachable Nodes
This occurs when a node exists in the diagram but cannot be reached from the initial node. This often happens when refactoring a diagram and forgetting to update a flow connection. Always run a reachability analysis on your model.
2. Unreachable Final Nodes
Conversely, a final activity node that cannot be reached from the start node is useless. It implies a state that the system can never enter. Ensure all termination states are accessible.
3. Overuse of Nested Flows
While nesting is powerful, overusing it creates a “black box” effect. If a nested activity is too complex, it defeats the purpose of abstraction. Break it down into smaller, manageable sub-diagrams.
4. Ambiguous Decision Nodes
Decision nodes that do not cover all possible outcomes can lead to undefined behavior. Ensure that for every input, there is a defined output path. If a condition is missing, the flow should be considered invalid.
5. Mixing Data and Control Flow
Confusing object flows with control flows is a frequent error. Control flows determine order; object flows determine data transfer. Mixing them up can lead to logic errors where data is assumed to exist when it does not.
Summary of Key Takeaways 📝
The Interaction Overview Diagram is a vital tool for managing architectural complexity. It provides a clear view of how different parts of a system interact over time without getting bogged down in the minutiae of message sequences.
By focusing on entry points, exits, and nested flows, architects can create models that are both accurate and maintainable. Key considerations include ensuring a single initial node, defining clear termination states, and using nested activities to manage scope. Comparing the IOD against sequence diagrams helps determine the appropriate level of detail for specific design tasks.
Adhering to best practices regarding symbol consistency, line management, and reachability validation ensures the diagram remains a useful asset throughout the development lifecycle. Avoiding common pitfalls like unreachable nodes and ambiguous decisions prevents logical errors from propagating into the codebase.
Ultimately, a well-constructed Interaction Overview Diagram serves as a contract between design and implementation. It aligns the team on the intended behavior of the system and provides a reference point for future maintenance and evolution. As systems grow in complexity, the ability to abstract and visualize these interactions becomes increasingly critical for long-term success.