


Designing complex systems requires more than just listing requirements. It demands a clear visualization of how different parts of a system behave over time. The UML Interaction Overview Diagram (IOD) serves as a high-level map for these behaviors, bridging the gap between static structure and dynamic behavior. If you have ever struggled to visualize the flow of control between multiple sequence diagrams, this guide is for you.
This document provides a comprehensive breakdown of the Interaction Overview Diagram. We will move from basic definitions to the specific symbols used, the step-by-step process of construction, and common pitfalls to avoid. By the end of this session, you will understand how to construct a robust diagram that clarifies system logic without getting bogged down in unnecessary detail.
🧩 What Is an Interaction Overview Diagram?
An Interaction Overview Diagram is a type of behavior diagram in the Unified Modeling Language (UML). It is essentially a variation of an Activity Diagram that focuses specifically on interactions. While a standard Activity Diagram shows the flow of control or data through a process, an IOD allows you to group those activities into specific interaction frames.
Think of it this way: A Sequence Diagram shows a conversation between objects in detail. An Interaction Overview Diagram shows the sequence of conversations that make up the whole process. It is the glue that holds multiple detailed interactions together.
Key Characteristics
- High-Level View: It abstracts the details of individual interactions.
- Control Flow: It uses standard activity node logic (decision, merge, loop) to manage the flow between interactions.
- Reusability: You can reference complex interaction logic multiple times without redrawing it.
- Clarity: It reduces clutter by hiding internal object interactions until they are necessary.
🛠️ The Building Blocks: Symbols and Notation
To draw this diagram effectively, you must understand the standard notation. UML is a language, much like English or Python. If you use the wrong grammar, the meaning gets lost. Below is a breakdown of the essential elements you will need.
Core Elements Table
| Symbol Name | Visual Representation | Function |
|---|---|---|
| Activity Node | 🔵 Circle or Rounded Rectangle | Represents a single step or action in the flow. |
| Interaction Frame | 📦 Large Rectangle with Label | Encapsulates a specific interaction (like a Sequence Diagram) within the overview. |
| Control Flow | ➡️ Arrow with Open Head | Indicates the sequence of execution from one node to another. |
| Decision Node | 🔶 Diamond | Branches the flow based on a condition (Yes/No, True/False). |
| Merge Node | ⚡ Small Circle or Junction | Combines multiple flows back into a single path. |
| Initial Node | ⚫ Solid Circle | The starting point of the diagram. |
| Final Node | ⚪ Circle with Border | The termination point of the flow. |
Notice how the Interaction Frame acts as a container. Inside this frame, you might see internal details, but from the outside, it is treated as a single action. This encapsulation is the primary reason to use this diagram type.
📝 Step-by-Step: Drawing Your First Diagram
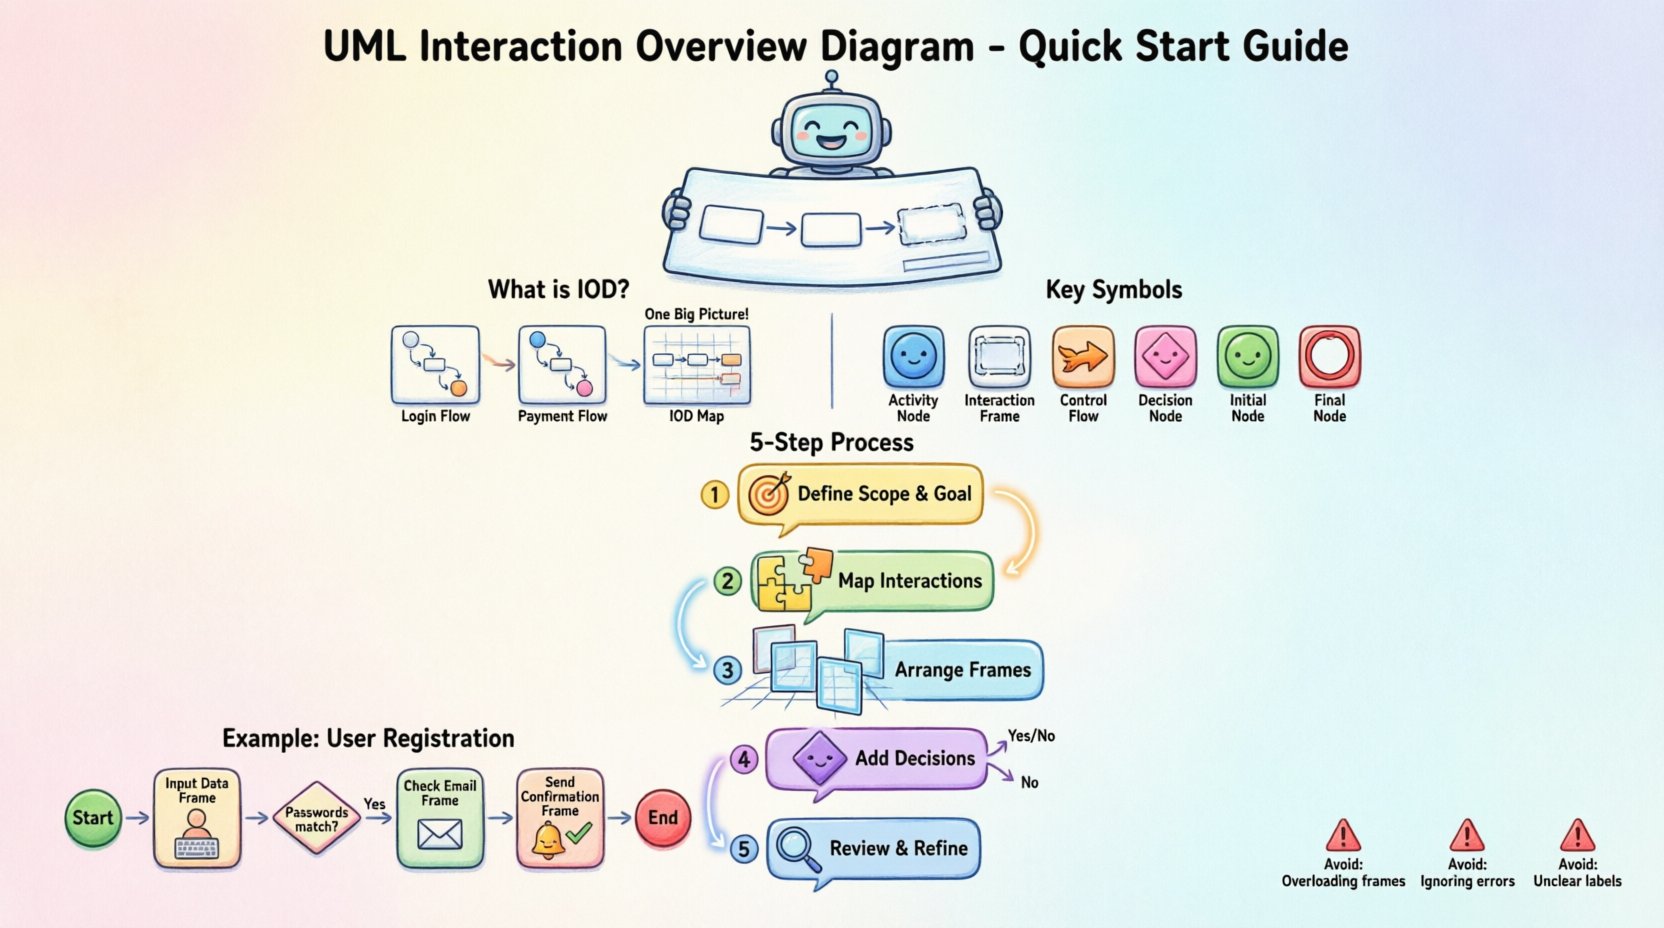
Ready to start? You do not need expensive software or a PhD in systems engineering. You need a clear process. Follow these five steps to draft your first Interaction Overview Diagram in approximately 15 minutes.
Step 1: Define the Scope and Goal
Before drawing a single line, write down the specific process you are modeling. Is it a user login? Is it a payment processing workflow? Is it an order fulfillment cycle?
- Input: What triggers the process?
- Output: What is the final result?
- Boundaries: What is not included in this diagram?
Example: “Model the user login process including password reset and failed attempts.”
Step 2: Identify the Interactions
Break the process down into discrete interactions. These are the moments where objects communicate. If you have already created Sequence Diagrams for these parts, you can use them as the content for your frames.
- List every distinct conversation required to move from start to finish.
- Assign a name to each interaction (e.g., “Validate Credentials”, “Fetch User Data”, “Send Notification”).
- Ensure these names are consistent across your documentation.
Step 3: Arrange the Frames
Place your interaction frames on the canvas. Do not worry about perfection yet. Use the standard activity flow logic:
- Start: Place the Initial Node at the top or left.
- Flow: Draw arrows connecting the frames in logical order.
- End: Place the Final Node at the bottom or right.
If you have loops or conditional paths, leave space for Decision Nodes.
Step 4: Add Control Logic
This is where the diagram becomes dynamic. You need to define how the system decides what happens next.
- Decisions: Use a diamond shape when a condition exists (e.g., “Is password correct?”). Label the outgoing arrows with the condition (e.g., “Yes”, “No”).
- Merges: Use a circle or junction where paths come back together.
- Loops: If a process repeats, draw the flow back to an earlier node, often using a fork node or a specific loop frame.
Step 5: Review and Refine
Look at the diagram from a distance. Does the flow make sense? Are there any orphaned nodes (nodes with no incoming or outgoing arrows)? Are the labels clear?
- Check for clarity: Can a new developer read this and understand the logic?
- Check for completeness: Are all error paths accounted for?
- Check for simplicity: Can any interaction be removed or merged?
🔄 Managing Complexity with Control Flow
One of the biggest challenges in system design is managing complexity. The Interaction Overview Diagram excels here because it allows you to nest complexity. You can have a high-level overview of the system, and then drill down into specific frames for details.
Decision Nodes Explained
Decision nodes represent binary or multi-way branching. In a UML context, they are usually diamonds.
- Condition: The condition must be evaluated at the node.
- Output: Each outgoing edge must be labeled with the condition that leads to it.
- Completeness: All possible outcomes must be covered. If you have a “Yes” and “No” path, ensure there are no gaps.
Looping Structures
Systems often require repetition. In an Activity Diagram context, this is handled by looping back to a previous node. In an IOD, this might mean retrying an interaction.
- Retry Logic: If an API call fails, loop back to the “Send Request” interaction.
- Validation: If a user input is invalid, loop back to the “Get Input” interaction.
- Termination: Ensure there is a clear exit condition from the loop to prevent infinite execution.
🆚 Interaction Overview vs. Sequence vs. Activity
Confusion often arises between the three main behavioral diagrams. Understanding when to use which one is critical for effective documentation.
| Diagram Type | Primary Focus | Best Used For | Detail Level |
|---|---|---|---|
| Interaction Overview | Flow of Control between Interactions | Complex workflows involving multiple conversations. | Medium (High-level flow, detailed frames) |
| Sequence Diagram | Object Communication over Time | Specific logic within a single interaction. | High (Messages, lifelines, activations) |
| Activity Diagram | Business Logic and Data Flow | General process flows, algorithms, state changes. | Medium to High (Actions, data objects) |
Use the Interaction Overview when a single Sequence Diagram is too simple, but an Activity Diagram is too abstract. It is the perfect middle ground for orchestrating complex system behaviors.
🚧 Common Mistakes to Avoid
Even experienced modelers make mistakes. Recognizing these pitfalls early will save you hours of rework.
1. Overloading the Frame
Do not put too much detail inside an Interaction Frame. The frame represents a conversation, not a script. If you find yourself adding hundreds of messages inside the frame, consider splitting it or moving details to a separate diagram.
2. Ignoring Error Paths
It is easy to draw the “Happy Path” (where everything works). However, a robust system handles errors. Ensure you have Decision Nodes that account for failures, timeouts, or invalid inputs.
3. Mixing Logic Types
Do not mix data flow and control flow in the same arrow unless it is explicitly defined. Keep the arrows representing control (execution order) distinct from arrows representing data (information transfer) to maintain clarity.
4. Unclear Labels
Avoid generic labels like “Process” or “Action.” Be specific. Use “Validate Credit Card” instead of “Process Payment.” Specificity reduces ambiguity for stakeholders.
💡 Practical Example: User Registration Flow
Let us walk through a concrete example to solidify the concepts.
Scenario: A user attempts to register for a service.
Step 1: Start Node. The process begins.
Step 2: Interaction Frame A (Input Data). User enters email and password.
Step 3: Decision Node. Are the passwords matching?
- No: Flow to Error Message Frame.
- Yes: Flow to Next Step.
Step 4: Interaction Frame B (Check Existence). System checks if email exists.
- Exists: Flow to Conflict Resolution Frame.
- New: Flow to Send Confirmation Frame.
Step 5: Interaction Frame C (Send Confirmation). Email is sent to user.
Step 6: Final Node. Registration process complete.
This structure allows you to see the entire lifecycle without needing to read the internal message sequences of every single email validation or database lookup.
🔧 Best Practices for Maintenance
Diagrams are living documents. They must evolve as the system changes. Follow these guidelines to keep your Interaction Overview Diagrams relevant.
- Version Control: Treat your diagrams like code. Keep track of changes.
- Single Source of Truth: Ensure the diagram matches the implementation. If the code changes, update the diagram.
- Regular Reviews: Include diagram reviews in your sprint planning or design meetings.
- Consistency: Use the same naming conventions for frames and nodes across all diagrams in the project.
❓ Frequently Asked Questions
Here are answers to common questions regarding the Interaction Overview Diagram.
Q: Can I use this diagram for non-software systems?
A: Yes. While UML is designed for software, the logic applies to any process involving interactions between components. Business workflows, manufacturing processes, or service delivery chains can all benefit from this visualization.
Q: How many frames are too many?
A: There is no hard limit, but if you have more than 10 to 15 frames, the diagram may become too complex to read effectively. Consider splitting the system into sub-processes and creating separate overview diagrams for each.
Q: Do I need to draw the internal sequence for every frame?
A: No. You can reference an existing Sequence Diagram. The Interaction Overview Diagram is designed to reference these details externally. You only need to draw the internal details if the interaction is simple or if the reference does not exist.
Q: Can I show parallel processes?
A: Yes. You can use Fork and Join nodes to indicate that multiple interactions happen simultaneously. This is crucial for systems that require parallel processing or multi-threaded operations.
Q: Is this diagram suitable for agile development?
A: Absolutely. Agile teams often use these diagrams to visualize user stories and acceptance criteria. They help ensure that the team understands the flow before coding begins, reducing rework.
🌟 Final Thoughts on Diagramming
Creating a UML Interaction Overview Diagram is about communication. It is a tool to ensure that everyone involved in the project shares a mental model of how the system behaves. By focusing on the control flow between interactions, you simplify complex logic without losing critical detail.
Remember that diagrams are not the end product; they are a means to an end. The goal is to build better software, not to create perfect drawings. Keep the process practical, focus on clarity, and use the symbols to guide your thinking rather than constrain it.
With these steps and guidelines, you are now equipped to draw your first Interaction Overview Diagram. Start small, iterate often, and watch as the complexity of your system begins to reveal its structure clearly.