


UML (Unified Modeling Language) offers a variety of tools for visualizing system behavior. Among these, the Interaction Overview Diagram (IOD) often sits in the shadows of its more popular cousin, the Sequence Diagram. Developers and architects frequently assume the IOD is merely a scaled-up version of a sequence diagram, or a way to stitch multiple sequence diagrams together. This assumption is incorrect. While they share DNA, the UML Interaction Overview Diagram serves a distinct purpose: it models high-level control flow and decision logic across interactions, not just message timing.
This guide dissects the IOD. We will explore its structure, distinguish it from sequence diagrams, and identify the specific scenarios where it provides genuine architectural value. By the end, you will understand when to deploy this tool and when it adds unnecessary complexity.
🧐 What Is an Interaction Overview Diagram?
An Interaction Overview Diagram is a type of activity diagram. It uses activity node notation to describe the control flow of interactions. Think of it as a flowchart for system interactions. Instead of drawing lines for every single message sent between objects (as in a sequence diagram), you draw paths that represent the flow of control from one interaction to another.
Here is a breakdown of its core components:
- Control Nodes: These represent the flow of logic. Includes initial nodes, decision nodes, merge nodes, and final nodes.
- Interaction Frames: These are the boundaries where specific interactions occur. They encapsulate sequence diagrams or other interaction diagrams.
- Object Nodes: These represent the state of data or objects being passed between interactions.
- Control Flow Edges: Arrows that dictate the order in which interactions are executed.
Unlike a pure sequence diagram, which focuses on the when and how of messages, the IOD focuses on the what comes next in a complex workflow. It allows you to model loops, conditional branching, and parallelism at a higher level of abstraction.
🔄 The Core Myth: IOD vs. Sequence Diagram
The most common misconception is that an IOD is just a collection of sequence diagrams glued together. While you can embed sequence diagrams inside an IOD, the IOD itself is not a sequence diagram. The distinction lies in the abstraction level.
In a sequence diagram, you see every message. You see the activation bars. You see the precise timing. In an IOD, you abstract the entire sequence into a single node. You are not concerned with the internal messages of that node; you are concerned with the entry and exit points.
Consider the following comparison table to visualize the structural differences:
| Feature | Sequence Diagram | Interaction Overview Diagram |
|---|---|---|
| Primary Focus | Message ordering and timing | Control flow and logic branching |
| Granularity | Low (individual messages) | High (interaction blocks) |
| Logic Representation | Implicit (via lifelines) | Explicit (decision nodes, loops) |
| Complexity Handling | Poor (becomes cluttered quickly) | Strong (manages branching well) |
| Notation Type | Interaction Diagram | Activity Diagram variant |
| Best For | Detailing specific scenarios | Orchestrating multiple scenarios |
🏗️ When the Interaction Overview Diagram Adds Value
Using an IOD is not about showing off; it is about solving a specific communication problem. Here are the scenarios where this diagram type shines.
1. Complex Decision Logic
When a process involves multiple conditional branches, a sequence diagram becomes a maze. Imagine a checkout process where:
- If the user is logged in, verify session.
- If not, show login form.
- If login fails, show error.
- If login succeeds, proceed to cart.
- If cart is empty, show warning.
- If cart has items, process payment.
- If payment fails, retry or cancel.
Trying to map this linearly in a sequence diagram results in dozens of vertical lifelines and horizontal arrows. An IOD allows you to collapse these into decision nodes. You can draw a diamond shape for the login check, and draw two distinct paths: one leading to the “Cart” node, another leading to the “Error” node. This makes the logic immediately visible without reading every message.
2. Orchestrating Multiple Sub-processes
Systems are rarely single-threaded. They often delegate tasks to other services. An IOD is excellent for showing the orchestration layer. You can place a node labeled “External Payment Service” inside the overview. The flow moves to that node, waits (conceptually), and returns to the main flow. This separates the orchestration logic from the implementation details of the payment service.
3. Modeling Loops and Iterations
Sequence diagrams handle loops poorly. They usually require a fragment labeled “loop” with a condition. While functional, it can get messy if the loop body is complex. The IOD treats the loop as a control flow construct. You can loop back to a specific interaction frame, clearly indicating that the interaction repeats until a condition is met. This is particularly useful for retry mechanisms or polling processes.
4. Bridging Activity and Interaction Models
Activity diagrams show business processes but lack object interaction details. Sequence diagrams show object details but lack business process flow. The IOD sits in the middle. It provides the structure of an activity diagram (flow) with the semantics of an interaction diagram (objects and messages). This makes it a perfect bridge for technical architects who need to explain how a business rule is implemented without getting bogged down in code-level message sequences.
🚧 When NOT to Use an Interaction Overview Diagram
Just because a tool exists does not mean it is the right tool for every job. Misusing the IOD can lead to diagrams that are harder to read than the alternatives.
- Simple Linear Flows: If your interaction is strictly linear (A calls B, B calls C, C finishes), a sequence diagram is clearer. The IOD adds overhead for no gain.
- Timing-Sensitive Scenarios: If the exact timing of messages is critical (e.g., timeout handling, real-time constraints), the IOD is insufficient. It does not support detailed timing annotations well.
- State-Dependent Logic: If the behavior depends heavily on the internal state of a single object, a State Machine Diagram is more appropriate than an interaction overview.
- Large-Scale System Architecture: For high-level system boundaries, use Component or Deployment diagrams. An IOD is too detailed for macro-level architecture.
🛠️ Anatomy of the Diagram: Key Notation Elements
To use this diagram effectively, you must understand the notation standards. Deviating from standard UML 2.x conventions can confuse readers who are familiar with the specification.
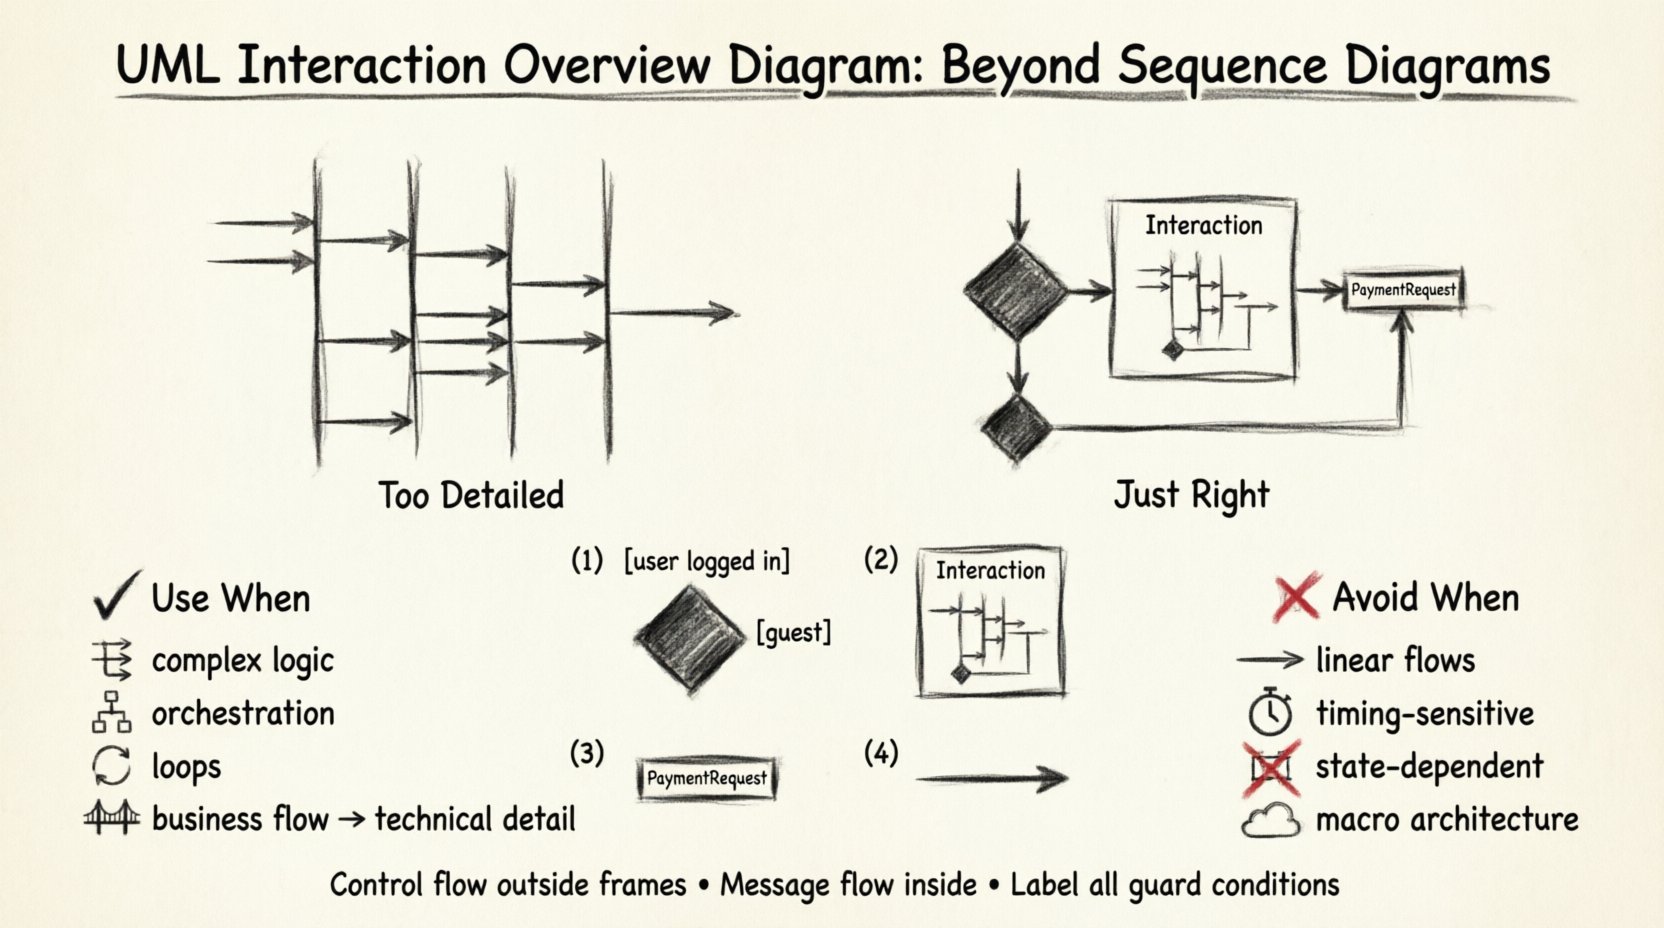
1. The Interaction Frame
This is the rectangle that contains the sequence diagram or other interaction details. It is labeled with the word “Interaction” at the top. Inside, you define the scope of the interaction. You can reference an external sequence diagram by name, keeping the overview clean.
2. Decision and Merge Nodes
These are black diamonds. A decision node splits the flow. It has one incoming edge and multiple outgoing edges. Each outgoing edge must have a guard condition (e.g., [user is logged in]). A merge node combines multiple flows back into one. It does not have guard conditions; it simply accepts any incoming path.
3. Object Nodes
In an IOD, you can pass data between interactions. An object node represents a token of data. For example, a “PaymentRequest” object node might flow from the “Initiate Payment” interaction to the “Process Transaction” interaction. This visualizes data dependencies clearly.
4. Control Flow Edges
These are the arrows connecting the nodes. Unlike sequence diagrams, which use message arrows, these represent the control passed from one interaction to the next. They are typically solid lines with a filled arrowhead.
🔗 Integrating with Other UML Diagrams
The IOD does not exist in a vacuum. It is part of a larger ecosystem of models. Understanding how it integrates prevents redundancy.
- With Class Diagrams: The object nodes in the IOD should correspond to classes defined in the Class Diagram. This ensures consistency in terminology.
- With State Machine Diagrams: You can use the IOD to show how the system moves between states defined in a State Machine. The “Interaction Frame” might represent the transition logic.
- With Activity Diagrams: The IOD is essentially an Activity Diagram where the activity nodes are replaced by interaction frames. If you are already using an Activity Diagram for high-level flow, ask yourself if the interaction details are necessary. If yes, use IOD. If no, stick to Activity Diagrams.
⚠️ Common Pitfalls and Best Practices
Avoiding errors is as important as knowing the features. Here are common mistakes made when creating Interaction Overview Diagrams.
Pitfall 1: The “Spaghetti” Overview
Attempting to model the entire system in one IOD leads to a diagram that is impossible to navigate. If the diagram requires scrolling horizontally for more than two screens, it is too complex.
Best Practice: Break the system into modules. Create one IOD for the “User Registration” flow, another for “Payment Processing”. Link them via the interaction frames.
Pitfall 2: Missing Guard Conditions
Decision nodes without guard conditions are ambiguous. A diamond node implies a choice. Without a label like [success] or [failure], the reader cannot know which path is taken.
Best Practice: Always label outgoing edges from decision nodes. Ensure all possible outcomes are covered (e.g., [yes] and [no]).
Pitfall 3: Mixing Control and Message Flow
Do not draw message arrows inside the interaction frame if you are using the IOD to control the flow. If you are showing messages, use the embedded sequence diagram. If you are showing flow, use control edges.
Best Practice: Keep the control flow outside the interaction frames. Keep the message flow inside them.
Pitfall 4: Ignoring Data Flow
An IOD often implies data movement without showing it. If the output of one interaction is critical input for the next, represent this using Object Nodes.
Best Practice: Use object nodes to visualize data passing between interactions. This helps identify dependencies that might cause race conditions or data loss.
📊 Case Study: The Refund Process
To illustrate the value, consider a refund process. This involves multiple systems: the Order System, the Inventory System, and the Payment Gateway.
Scenario A: Sequence Diagram Approach
You would create a sequence diagram for “Refund Success” and another for “Refund Failure”. You would then need a third diagram for “Refund Partial”. You would have three separate diagrams. A stakeholder reviewing the process would have to jump between them to understand the full logic.
Scenario B: Interaction Overview Diagram Approach
You create one IOD. The flow starts at “Initiate Refund”. It goes to a Decision Node “Is Item Eligible?”.
- Yes: Flow goes to “Check Inventory”. Then “Contact Payment Gateway”. Then “Process Refund”.
- No: Flow goes to “Notify User”.
Inside the “Contact Payment Gateway” node, you embed a small sequence diagram showing the API call. This single diagram provides the high-level logic and the low-level detail where needed. It reduces cognitive load for the reader.
🔍 Technical Implementation Details
When implementing these diagrams in a modeling tool, pay attention to the following technical constraints.
- Frame Types: Ensure the tool supports the “Interaction” frame type, not just the generic “Frame” type. This changes the semantic interpretation.
- Swimlanes: While IODs can use swimlanes (partitions), they are less common than in Activity Diagrams. If you use swimlanes, ensure they represent the participants (actors/systems) rather than just departments.
- Concurrency: IODs support concurrent flows using fork and join nodes. Use these when multiple interactions happen in parallel. For example, sending an email notification while simultaneously logging the transaction.
- Exception Handling: Use exception handlers in the control flow. If an interaction throws an error, the flow should divert to a “Error Handler” node rather than stopping abruptly.
📝 Summary of Value
The UML Interaction Overview Diagram is a specialized tool for a specific job. It is not a replacement for sequence diagrams, nor is it a replacement for activity diagrams. It is the hybrid that handles complex control logic across interactions.
Key takeaways:
- Use it for: Branching logic, looping interactions, orchestrating multiple services, and bridging business flow with technical implementation.
- Avoid it for: Simple linear messages, precise timing analysis, or high-level architectural boundaries.
- Design Rule: Keep the control flow outside the interaction frames. Keep the message flow inside.
- Clarity: Always label decision nodes with guard conditions.
By respecting the boundaries of this diagram type, you can communicate complex system behaviors more effectively. You stop hiding logic inside dense message sequences and start exposing the actual decision points that drive the system. This clarity saves time during code reviews, architectural planning, and onboarding new team members.
When you need to explain how a decision is made across multiple interactions, reach for the Interaction Overview Diagram. It provides the structure needed to map the path without losing the interaction details where they matter most.