


Software development is a complex discipline that relies heavily on clear communication. When systems grow, the interactions between components become intricate. Developers need tools to visualize these behaviors before writing code. The Unified Modeling Language (UML) provides several diagrams for this purpose. Among them, the Interaction Overview Diagram stands out as a high-level control flow tool. It bridges the gap between static structure and detailed sequence logic.
This guide explores the Interaction Overview Diagram (IOD). We will examine its structure, components, and practical applications. Whether you are designing a new microservice or refactoring legacy logic, understanding this diagram type adds significant value to your workflow. We will avoid jargon where possible and focus on practical clarity.
🧩 What Is an Interaction Overview Diagram?
An Interaction Overview Diagram is a type of activity diagram that uses interaction diagrams as its primary nodes. It visualizes the control flow of a system at a high level. Think of it as a roadmap that connects different snapshots of system behavior. While a sequence diagram shows the chronological order of messages between objects, an IOD shows the order of those interactions within a broader process.
It is particularly useful when a single sequence diagram becomes too crowded. Complex logic often involves branching paths, loops, or conditional execution. An IOD allows you to organize these branches without cluttering a single timeline. It treats entire interaction scenarios as atomic actions within a larger workflow.
Key Characteristics:
- ✅ Combines activity diagram syntax with interaction diagram content.
- ✅ Focuses on control flow rather than detailed message passing.
- ✅ Ideal for high-level process visualization.
- ✅ Supports branching, merging, and looping logic.
🛠 Core Visual Elements
To create an effective IOD, you must understand its building blocks. These elements define how the flow moves from one interaction to another. Each symbol carries specific meaning regarding execution order.
1. Activity Nodes
An activity node represents a specific action or step in the process. In an IOD, this is often an entire Interaction Diagram. It signifies that a complex interaction sequence is happening here. You do not see individual messages inside this node. Instead, the node represents the completion of that interaction.
2. Control Flow Edges
Control flow edges are arrows that connect activity nodes. They indicate the order in which activities are executed. If one node finishes, the control passes to the next connected node. These edges are the primary drivers of the diagram’s logic.
3. Initial and Final Nodes
Every flow needs a start and an end. The Initial Node is a small filled circle. It marks where the process begins. The Final Node is a circle with a border. It marks the successful completion of the workflow. There can be multiple final nodes if different paths lead to different outcomes.
4. Decision and Merge Nodes
Software rarely follows a straight line. Logic often requires choices. A Decision Node (a diamond) splits the flow. It evaluates a condition. Depending on the result, control moves along a different edge. A Merge Node does the opposite. It brings multiple paths back together into a single flow. This is essential for handling conditional logic without losing track of the main sequence.
5. Fork and Join Nodes
Parallel execution is common in modern systems. A Fork Node splits a single flow into multiple concurrent paths. A Join Node waits for all incoming paths to complete before continuing. This is vital for visualizing tasks that happen simultaneously, such as sending an email and updating a database.
📊 Interaction Overview vs. Sequence Diagram
Junior developers often confuse these two diagram types. Both deal with interactions, but their scope differs significantly. Understanding the distinction ensures you choose the right tool for the job.
| Feature | Sequence Diagram | Interaction Overview Diagram |
|---|---|---|
| Focus | Detailed message exchange over time | High-level control flow between interactions |
| Complexity | Best for linear, step-by-step logic | Best for branching, loops, and alternatives |
| Granularity | Low-level (individual method calls) | High-level (entire interaction scenarios) |
| Usage | Implementing specific features | Architecting system workflows |
| Visual Layout | Vertical time axis | Flowchart style (top to bottom or left to right) |
If you need to show exactly how an API handles a request, use a sequence diagram. If you need to show how a user login process branches based on authentication status, use an interaction overview diagram.
🚧 Constructing an IOD: Step-by-Step
Building a diagram requires a structured approach. You cannot simply draw shapes and expect clarity. Follow this workflow to ensure your diagram communicates effectively.
Step 1: Define the Scope
Start by identifying the specific business process. Is it an order fulfillment flow? A user registration process? Define the boundaries. What triggers the start? What defines the end? This prevents scope creep where the diagram becomes too large to read.
Step 2: Identify Major Interactions
Break the process down into major interaction blocks. These will become your activity nodes. For example, in a payment system, the blocks might be “Validate Card”, “Process Transaction”, and “Notify User”. Each block represents a significant interaction sequence.
Step 3: Map the Control Flow
Draw the edges connecting these blocks. Determine the order. Where does control go next? Are there conditions? Use decision nodes for branches. Ensure every path leads logically to a final node.
Step 4: Add Details
Refine the diagram. Add labels to edges. Specify guard conditions (e.g., [Valid], [Invalid]). Ensure parallel branches are clear. Use partitions (swimlanes) if different actors or systems are involved.
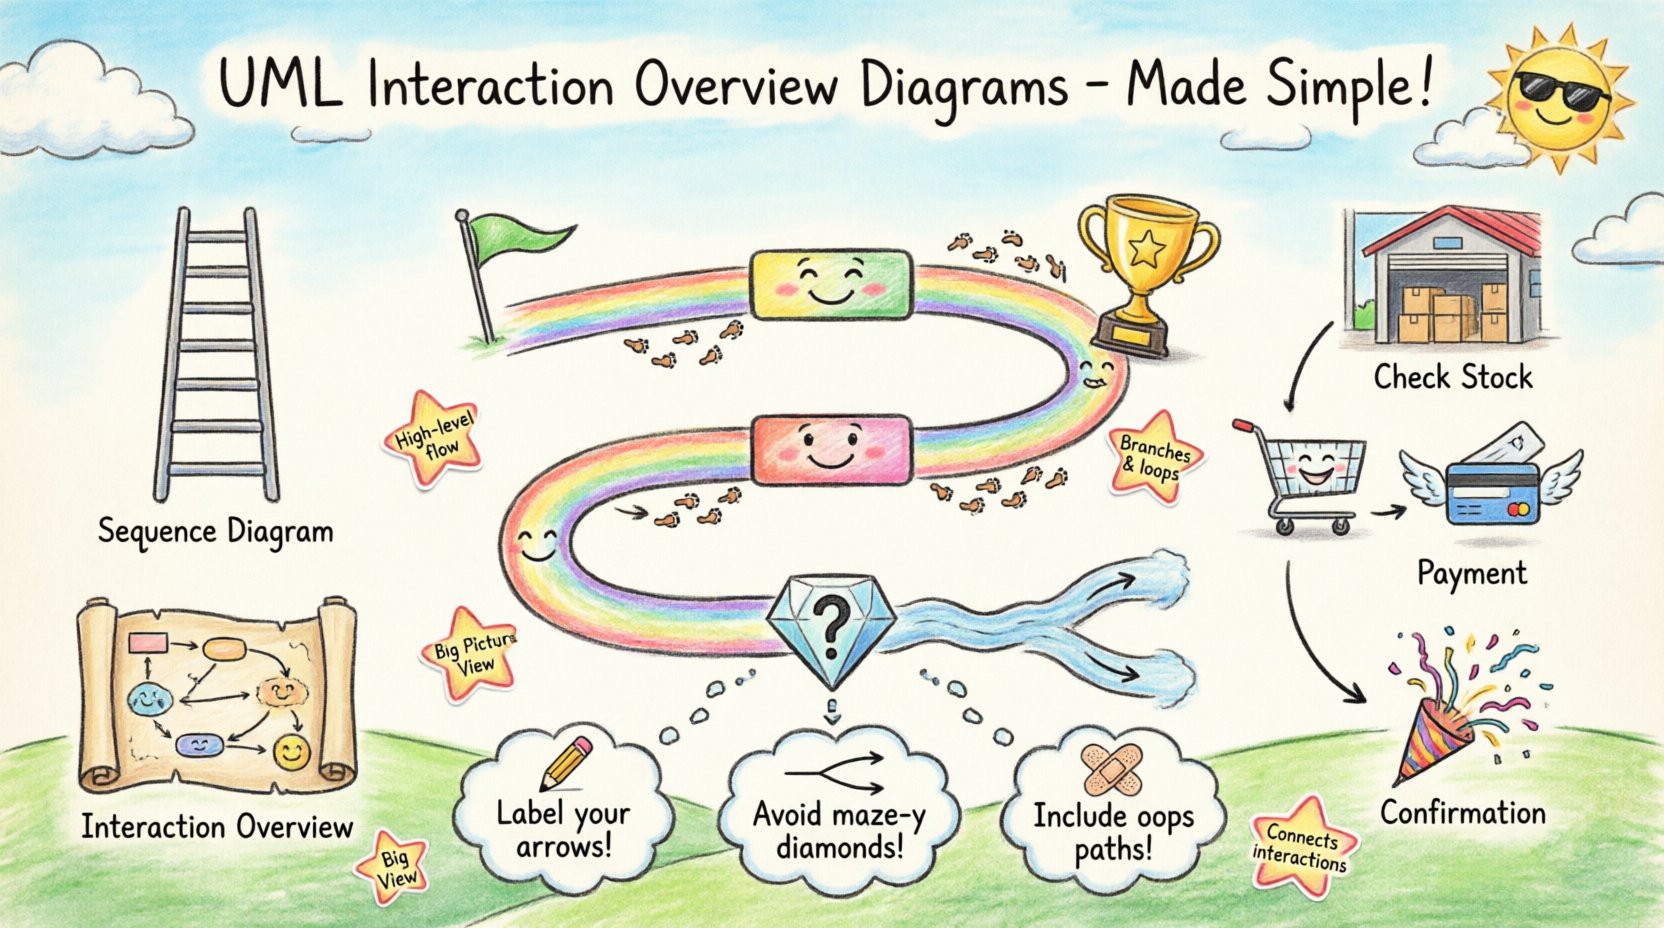
🌐 Practical Scenario: E-Commerce Checkout
Let us visualize a real-world scenario. Consider an e-commerce checkout process. This involves multiple systems: the user interface, the inventory service, the payment gateway, and the notification service.
Workflow Logic:
- Start: User clicks “Place Order”.
- Check Inventory: The system verifies stock availability.
- Branch:
- If Stock is Low: Show warning and ask for confirmation.
- If Stock is High: Proceed to payment.
- Payment: Process the transaction.
- Branch:
- If Payment Fails: Display error and return to start.
- If Payment Succeeds: Update inventory and send email.
- End: Order Confirmation.
In an Interaction Overview Diagram, “Check Inventory” is one node. “Payment” is another node. The arrows between them represent the control flow. The decision diamonds represent the stock check and payment success checks. This structure allows stakeholders to see the overall process without getting lost in the details of every API call.
⚠️ Common Pitfalls to Avoid
Even experienced engineers make mistakes when designing these diagrams. Awareness of common errors helps you produce cleaner documentation.
1. Mixing Levels of Abstraction
Do not mix high-level flow control with low-level message details. If a node represents an interaction, do not draw the messages inside the node on the same diagram. Keep the IOD for the flow, and use a sequence diagram for the details within the node.
2. Overusing Decision Nodes
Too many diamonds make the diagram look like a maze. If a decision is complex, consider splitting it into separate diagrams. Simplicity aids understanding. Limit the number of branches coming out of a single node.
3. Ignoring Error Paths
Happy paths are easy to draw. Unhappy paths are often forgotten. A robust IOD includes error handling. What happens if a service is down? Ensure there is a path for failure that leads to a meaningful outcome, such as a rollback or user notification.
4. Circular Logic
Avoid loops that never terminate. While loops are valid, they must have a clear exit condition. Infinite loops in a diagram suggest infinite loops in the code, which is usually a bug.
5. Lack of Labels
Arrows without text are ambiguous. Always label your edges. Use guard conditions like [Success] or [Timeout]. This removes guesswork for anyone reading the diagram.
🔗 Integration with Other UML Diagrams
An Interaction Overview Diagram does not exist in isolation. It works best when integrated with the rest of your UML suite.
Class Diagrams
Class diagrams define the structure. They show which objects exist. The IOD shows how these objects interact over time. You can reference specific classes from the class diagram as participants in the interaction nodes.
State Machine Diagrams
State machines describe the behavior of a single object. IODs describe the collaboration between objects. Use state machines for the internal logic of a component and IODs for the flow between components.
Component Diagrams
Component diagrams show the physical deployment. IODs show the logical flow. Together, they provide a complete picture of how software moves from code to execution.
📝 Best Practices for Clarity
Clarity is the primary goal of any documentation. Follow these tips to ensure your diagrams are effective.
- Use Swimlanes: Group activities by actor or system. This makes it clear who is responsible for each step.
- Limit Width: Try to keep the diagram width manageable. If it spills over pages, consider splitting the process.
- Consistent Notation: Stick to standard UML shapes. Do not invent new symbols. Deviations confuse readers.
- Readable Text: Keep labels short. Long descriptions belong in the accompanying documentation, not on the diagram.
- Review Regularly: Diagrams can become outdated as code changes. Treat them as living documents that require updates.
🎓 Why This Matters for Junior Developers
Learning to design an IOD is a skill that distinguishes a coder from an engineer. It forces you to think about the system as a whole rather than individual functions. It encourages you to identify edge cases early. It improves communication with senior architects and product managers.
When you can visualize the flow of control, you can spot bottlenecks before they become performance issues. You can identify potential race conditions in parallel branches. You can explain complex logic to stakeholders using a visual aid that is easier to digest than a code snippet.
Invest time in learning the syntax. Practice drawing simple workflows. Start with small features and expand as you gain confidence. This skill will serve you throughout your career.
📌 Summary of Key Takeaways
- 💡 Interaction Overview Diagrams visualize control flow between interaction scenarios.
- 💡 They are best used for complex logic with branches and loops.
- 💡 Distinguish them from Sequence Diagrams by focusing on flow rather than message timing.
- 💡 Use activity nodes, decision diamonds, and control flow edges.
- 💡 Always include error paths and clear labels.
- 💡 Integrate with Class and State diagrams for a complete view.
Mastering the art of system design involves many tools. The Interaction Overview Diagram is one of the most powerful for managing complexity. By using it correctly, you create documentation that stands the test of time. You build a foundation for scalable, maintainable software.