


In the fast-paced world of software engineering, visual documentation serves as the bridge between abstract logic and concrete implementation. Among the various Unified Modeling Language (UML) notations, the Interaction Overview Diagram (IOD) stands out as a powerful tool for mapping complex control flows. While traditional Sequence Diagrams excel at detailing object interactions over time, they often struggle to represent high-level logic, branching paths, and iterative loops effectively. Modern development teams are increasingly turning to Interaction Overview Diagrams to navigate the complexities of Agile System Design. This guide explores the mechanics, applications, and future trajectory of this critical modeling artifact.
Understanding the Interaction Overview Diagram 📊
An Interaction Overview Diagram acts as a hybrid between a standard Activity Diagram and a Sequence Diagram. It provides a high-level view of the flow of control within a system. Instead of focusing on individual messages between objects, the IOD focuses on the overall flow of operations. It uses the same symbols as Activity Diagrams, such as decision nodes and merge nodes, but the content within the nodes can be Sequence Diagrams or other interaction fragments.
- Control Nodes: These represent the flow of control, similar to activity diagrams. They include initial nodes, final nodes, decision nodes, and merge nodes.
- Interaction Fragments: These are the core components. Each fragment represents a specific interaction scenario, often encapsulated as a Sequence Diagram.
- Links: Directed edges connect the control nodes and interaction fragments, defining the sequence of execution.
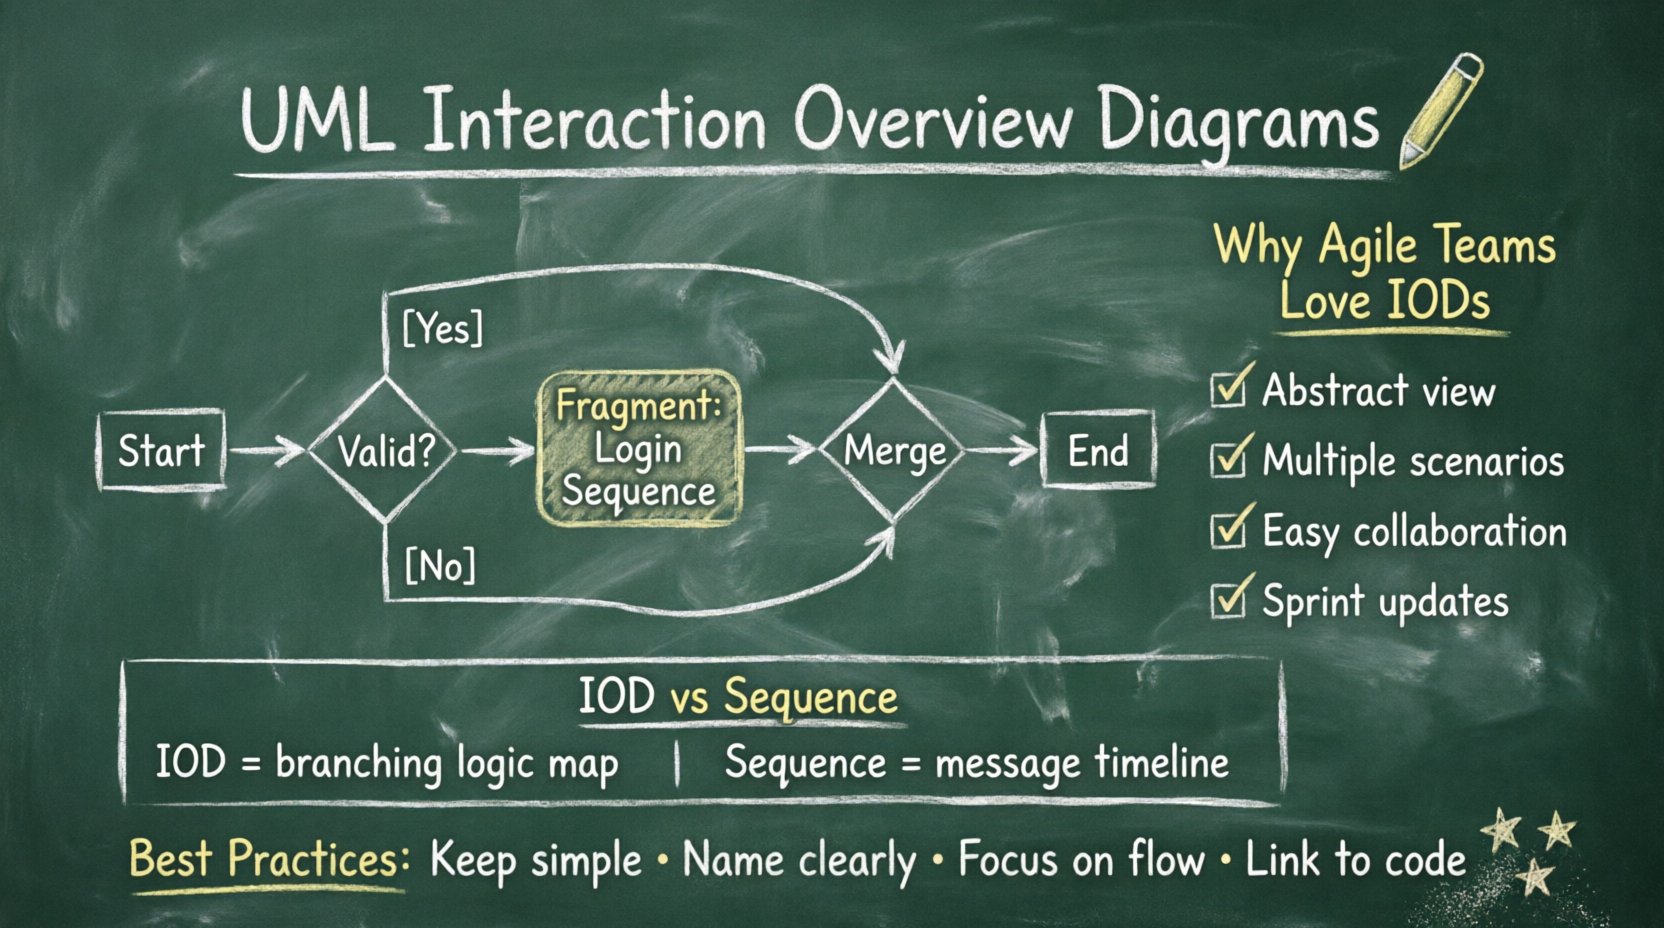
By combining these elements, developers can visualize how different scenarios fit together. For instance, a login process might branch based on user credentials. If the credentials are valid, a specific interaction fragment executes. If invalid, another fragment handles the error state. The IOD ties these fragments together into a cohesive narrative.
Why Interaction Overview Diagrams Matter in Agile Environments 🏗️
Agile methodologies prioritize flexibility, collaboration, and rapid iteration. Traditional documentation often becomes a bottleneck, requiring extensive updates that lag behind code changes. The Interaction Overview Diagram offers a solution by focusing on logic flow rather than granular message timing.
- High-Level Abstraction: Teams can discuss system behavior without getting bogged down in every single method call.
- Scenario Management: It handles multiple scenarios (happy path, error paths, edge cases) within a single view.
- Collaboration: Stakeholders can understand the system flow without needing deep technical knowledge of message sequences.
- Iterative Updates: Diagrams can be updated sprint by sprint to reflect changing requirements.
When a development team adopts an Agile workflow, requirements evolve. User stories are refined, and edge cases are discovered. The IOD adapts well to this fluidity. It allows architects to sketch out a flow, refine it in a backlog grooming session, and then decompose it into specific user stories for implementation.
Interaction Overview vs. Sequence Diagrams: A Detailed Comparison 🆚
Selecting the right diagram type is crucial for effective communication. While Sequence Diagrams are ubiquitous, they have limitations when dealing with complex control logic. The following table outlines the key differences to help teams decide when to utilize an Interaction Overview Diagram.
| Feature | Interaction Overview Diagram | Sequence Diagram |
|---|---|---|
| Focus | Control flow and logic branching | Message exchange and timing |
| Scope | High-level, multiple scenarios | Low-level, single scenario |
| Complexity | Manages loops and decisions well | Can become cluttered with many paths |
| Readability | Best for stakeholders and architects | Best for developers and testers |
| Structure | Activity diagram style with fragments | Vertical timeline of objects |
| Use Case | System architecture, flow validation | API contract, detailed logic |
Consider a payment processing system. A Sequence Diagram would show the exact order of calls between the Payment Gateway, the Bank API, and the User Interface. An Interaction Overview Diagram would show the decision logic: if payment fails, retry; if retry fails, notify user; if success, update inventory. Both are necessary, but the IOD provides the macro view that prevents developers from losing sight of the overall process.
Integrating IODs into the Development Lifecycle 🔗
Incorporating Interaction Overview Diagrams into a modern DevOps pipeline requires intention. It is not enough to draw them; they must serve a functional purpose in the build and deployment process. Here is how teams can integrate them effectively.
- Design Phase: During the architectural design, architects draft the IOD to validate the system flow. This happens before coding begins, ensuring the logic is sound.
- Story Definition: Developers break down the fragments within the IOD into user stories. Each fragment becomes a ticket in the backlog.
- Implementation: As code is written, the IOD is referenced to ensure the implementation matches the intended flow. It serves as a contract between design and code.
- Testing: QA teams use the IOD to create test cases. They verify that every decision node and path is covered by automated tests.
- Maintenance: When refactoring, the IOD is updated to reflect new logic. This prevents technical debt from accumulating in the documentation.
This integration ensures that documentation is not a static artifact created at the beginning of a project. Instead, it evolves alongside the codebase. By linking the diagram to specific tickets or branches, teams maintain traceability.
Technical Deep Dive: Control Nodes and Logic 🧠
To truly leverage the IOD, one must understand the underlying control nodes. These nodes dictate the path the system takes through the interaction fragments.
Decision Nodes
A decision node represents a point where the flow branches based on a condition. It has one input and multiple outputs. Each output is labeled with a guard condition, such as [Valid User] or [Invalid User]. Only one path is taken at a time. This is essential for handling business logic that depends on runtime data.
Merge Nodes
A merge node combines multiple flows into a single path. It is the counterpart to the decision node. Regardless of which path was taken previously, the system converges at the merge node to continue with common logic. This reduces redundancy in the diagram, as common actions (like logging or closing connections) do not need to be repeated for every branch.
Loop Nodes and Forks
Loops are common in systems that process collections or wait for events. An IOD can represent a loop by connecting a merge node back to a decision node. Fork nodes allow for parallel execution. If a system needs to send an email and update a database simultaneously, a fork node splits the flow. A join node then waits for both to complete before proceeding.
Challenges in Maintaining Interaction Overview Diagrams ⚠️
Despite their benefits, IODs present specific challenges that teams must manage. Documentation can quickly become outdated if not treated as a living artifact.
- Over-Engineering: Creating an IOD for every small function can lead to an explosion of diagrams. It is best to use them for complex flows that span multiple services or modules.
- Maintenance Overhead: If the code changes frequently, the diagram must change too. If the team does not have time to update the diagram, it becomes misleading.
- Tooling Limitations: Some modeling tools struggle with the hybrid nature of IODs, making it difficult to embed Sequence Diagrams within Activity-like structures.
- Learning Curve: Not every team member is familiar with the specific symbols and conventions of Interaction Overview Diagrams. Training is required to ensure consistent usage.
To mitigate these issues, teams should adopt a “documentation as code” mindset. Diagrams should be version controlled alongside the source code. Changes to the diagram should be reviewed in pull requests, just like code changes. This ensures accountability and keeps the documentation in sync with the system.
Future Trends: AI and Dynamic Modeling 🤖
The landscape of system design is shifting. Artificial Intelligence and machine learning are beginning to influence how diagrams are created and maintained. We are moving towards dynamic modeling where diagrams are generated from code analysis.
- Auto-Generation: Future tools may parse the codebase and automatically generate IODs that reflect the current state of the system. This reduces the manual effort required to maintain documentation.
- AI-Assisted Logic: AI can suggest potential decision nodes or edge cases that human architects might miss. It can analyze historical bug data to highlight risky paths in the flow.
- Real-Time Synchronization: In cloud-native environments, diagrams could update in real-time as services are deployed. If a microservice is added, the diagram updates to reflect the new interaction point.
- Interactive Prototyping: Instead of static images, future IODs might be interactive. Users could click through the flow to simulate the system behavior without running the actual code.
These advancements promise to reduce the burden on architects. However, the human element remains critical. AI can generate the structure, but humans must validate the business logic and ensure the system aligns with user needs.
Best Practices for Effective Documentation 📝
To get the most out of Interaction Overview Diagrams, teams should adhere to a set of best practices. These guidelines ensure clarity and utility.
- Keep It Simple: Avoid nesting too many levels of interaction fragments. If a flow becomes too complex, split it into multiple diagrams.
- Use Consistent Naming: Interaction fragments should have descriptive names. Avoid generic labels like
Fragment 1. UseValidate CredentialsorProcess Payment. - Focus on Logic, Not Timing: Do not use the IOD to specify exact timing constraints. That is the job of Sequence Diagrams or Timing Diagrams.
- Link to Code: Where possible, link the diagram to the specific repository or module. This creates a clear traceability path.
- Review Regularly: Include diagram reviews in sprint ceremonies. Ensure the visual representation matches the current implementation.
Implementing a Visual Strategy for Your Team 🎯
Adopting this visual strategy requires a shift in culture. It is not just about drawing pictures; it is about communicating intent. Teams should start small. Select a complex module in your current project and create an IOD for it. Evaluate whether it helps the team understand the flow better.
If the diagram clarifies the design and reduces misunderstandings during development, expand its use. If it becomes a burden, reassess the scope. The goal is to enhance productivity, not hinder it.
Training sessions can be valuable. Have an experienced architect walk the team through the symbols and the decision-making process. Encourage developers to contribute to the diagrams. This ownership ensures that the documentation remains accurate and relevant.
Final Thoughts on Visual System Design 💡
The Interaction Overview Diagram represents a maturation of visual modeling in software engineering. It addresses the limitations of linear sequence diagrams by introducing control flow and branching logic into the mix. As systems become more distributed and complex, the ability to visualize the overall flow becomes increasingly valuable.
Modern development teams that integrate these diagrams into their Agile workflows gain a significant advantage. They have a shared understanding of the system architecture, a clear path for testing, and a robust way to manage technical debt. While challenges exist regarding maintenance and tooling, the benefits of clarity and communication outweigh the costs.
By focusing on the logic rather than the minutiae, teams can ensure that the system behaves as intended. The future of system design lies in this balance between high-level abstraction and detailed implementation. Interaction Overview Diagrams provide the framework to achieve that balance.
As you move forward, consider where your current documentation falls short. Are there complex flows that are difficult to explain in text? Would a visual representation clarify the intent for new team members? The answer to these questions will guide your adoption of these modeling techniques.