


Understanding the physical architecture of a software system is critical for engineering teams. A deployment diagram provides a static view of the hardware and software components that make up a distributed environment. It maps the nodes, artifacts, and connections that define how an application runs in production. This guide explores the mechanics of creating, reading, and maintaining these diagrams without relying on specific vendor tools.
What is a Deployment Diagram? 📊
A deployment diagram is a type of diagram in the Unified Modeling Language (UML) that describes the physical architecture of a system. Unlike a class diagram, which focuses on code structure, or a sequence diagram, which focuses on behavior over time, the deployment diagram focuses on topology. It answers the question: “Where does the software run?”
These diagrams are essential for several reasons:
- Clarity: They provide a single source of truth for infrastructure layout.
- Communication: They bridge the gap between developers and operations teams.
- Planning: They help visualize scaling needs and redundancy strategies.
- Security: They highlight boundaries between trusted and untrusted networks.
Core Components of a Deployment Diagram 🧩
To construct an accurate diagram, you must understand the fundamental building blocks. Each element serves a specific purpose in representing the system’s runtime environment.
1. Nodes (Hardware and Software) 🖥️
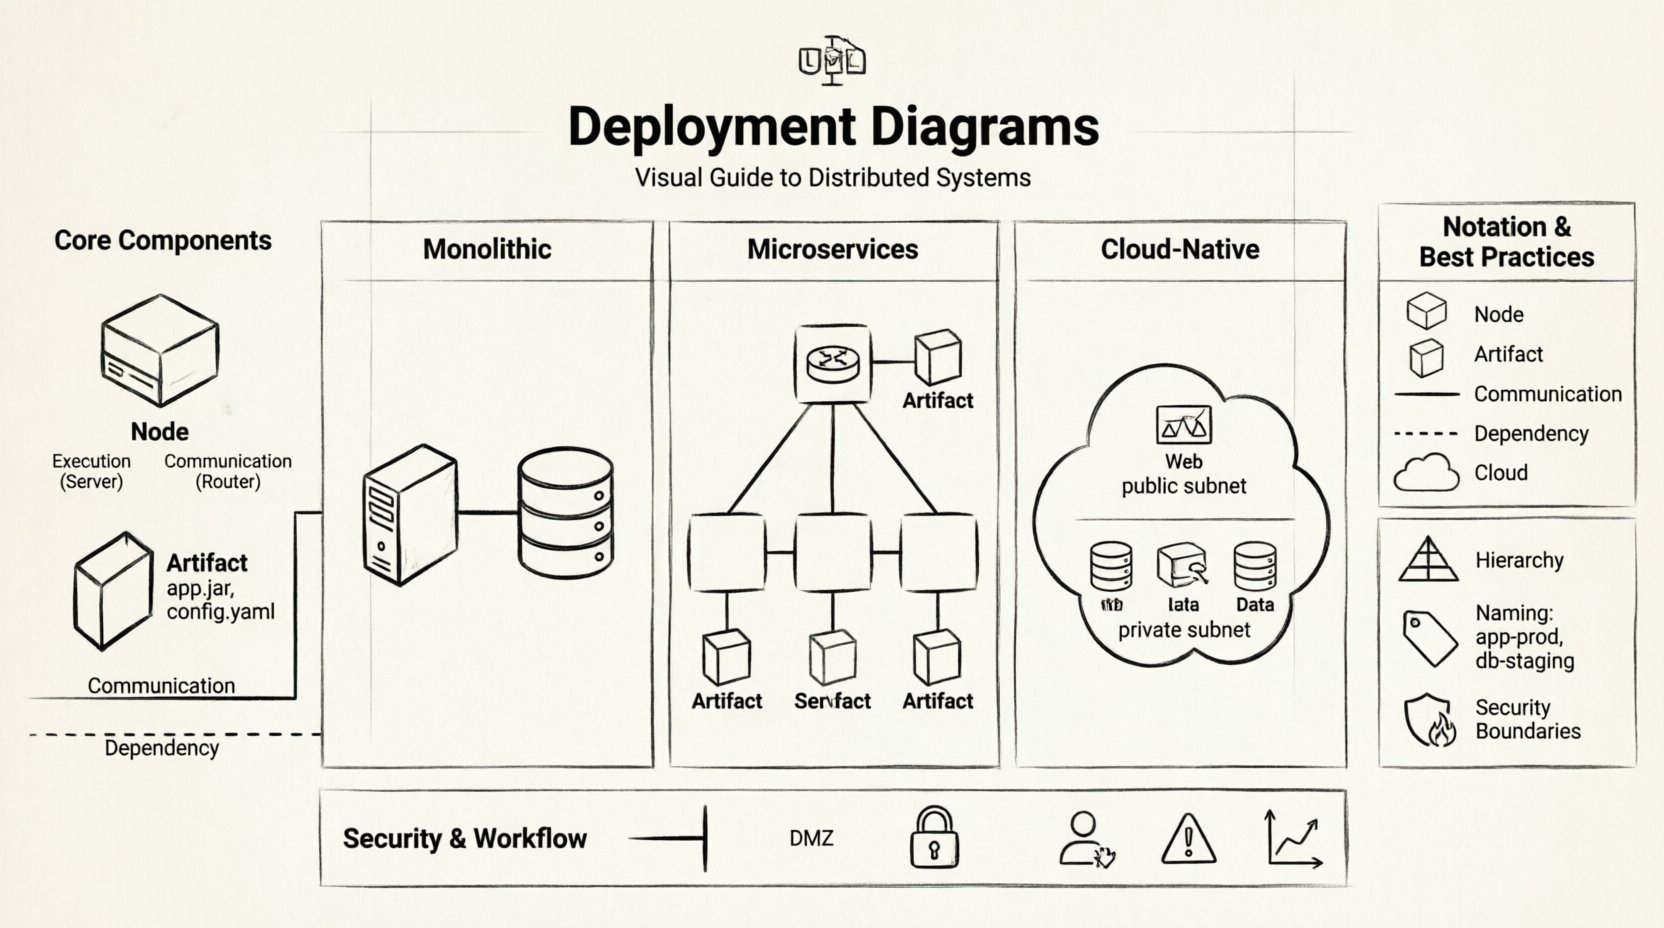
A node represents a physical or virtual computing resource. It is typically depicted as a 3D box. Nodes can be categorized into two main types:
- Execution Node: A computational resource that hosts artifacts. Examples include servers, mobile devices, or cloud instances.
- Communication Node: A device used for connecting other nodes, such as routers or firewalls. These often represent network boundaries.
When defining nodes, consider the following attributes:
- Type: Is it a server, a database, or a client device?
- OS: What operating system is running on the node?
- Capabilities: Does it have specific processing power or storage constraints?
2. Artifacts 📦
Artifacts are the physical files or components that reside on nodes. They represent the deployable units of software. Common examples include:
- Executable Files: Compiled binaries or scripts.
- Libraries: Shared dependencies required for execution.
- Database Schemas: The structure and data files stored on the system.
- Configuration Files: Settings that control application behavior.
Artifacts are usually shown as rectangles with a folded corner, placed inside or attached to the node that hosts them.
3. Connections 🌐
Lines connecting nodes and artifacts represent relationships. These are not just visual aids; they define how data flows through the system.
- Dependency: Indicates that one node or artifact relies on another to function.
- Communication: Represents a network connection, such as HTTP, TCP/IP, or a private link.
- Association: A general link showing that two elements are related in some capacity.
Common Deployment Patterns 🔗
Distributed systems vary widely in complexity. The diagram structure should reflect the architectural pattern being used. Below are three common scenarios.
1. Monolithic Architecture
In a monolithic setup, the entire application is deployed as a single unit. The diagram typically shows a single application server connected to a database server.
- Pros: Simple deployment, easy to manage.
- Cons: Harder to scale individual components.
- Diagram Focus: Show the direct link between the app server and the data store.
2. Microservices Architecture
Here, the system is broken into small, independent services. Each service may run on its own node or container.
- Pros: Scalable, resilient, independent updates.
- Cons: Complex network communication, requires orchestration.
- Diagram Focus: Use a load balancer node to distribute traffic to multiple service instances.
3. Cloud-Native Architecture
This pattern leverages cloud infrastructure. Nodes are often ephemeral, managed by an orchestration platform.
- Pros: High availability, auto-scaling.
- Cons: Vendor lock-in, complex networking setup.
- Diagram Focus: Distinguish between public and private subnets. Show managed services separately from self-managed nodes.
Standardizing Notation and Semantics 📐
Consistency is key when multiple teams interact with the same diagram. Adhering to standard notation prevents confusion.
Node Representation: Always use the 3D box shape. Label the node with its name and type.
Artifact Representation: Use the folded rectangle. Place the name of the file or package clearly.
Connectivity: Use solid lines for direct connections and dashed lines for logical dependencies or external interfaces.
Consider using a table to document the legend of your diagram for future reference.
| Symbol | Meaning | Usage Example |
|---|---|---|
| 3D Box | Node | Web Server, Database Server |
| Folded Rectangle | Artifact | application.jar, config.yaml |
| Solid Line | Communication | Network Traffic Flow |
| Dashed Line | Dependency | Software Requirement |
| Cloud Shape | External Network | Public Internet |
Best Practices for Design and Maintenance 🛠️
Creating a diagram is one task; keeping it accurate is another. Distributed systems evolve rapidly. A stale diagram can lead to deployment failures and security vulnerabilities.
1. Hierarchy and Abstraction
Do not try to show every single server in one diagram. Use hierarchy to manage complexity.
- High-Level View: Show regions, availability zones, and major service groups.
- Low-Level View: Drill down into specific clusters or database shards.
- Linkage: Use hyperlinks or reference notes to connect high-level nodes to detailed sub-diagrams.
2. Labeling and Naming Conventions
Clear labels reduce ambiguity. Follow a consistent naming convention for all nodes and artifacts.
- Prefixes: Use prefixes like
db-for databases orapp-for application servers. - Environment: Suffixes like
-prod,-dev, or-staginghelp distinguish environments. - Versioning: Indicate the version of the artifact on the node.
3. Security Boundaries
Security is often an afterthought in diagrams, but it should be a primary focus.
- Firewalls: Draw lines representing firewalls to show where traffic is filtered.
- DMZ: Clearly mark the Demilitarized Zone where public-facing services reside.
- Encryption: Note where encryption is required for data in transit (e.g., HTTPS).
Common Challenges and Solutions ⚠️
When working with deployment diagrams, teams often encounter specific hurdles. Understanding these challenges helps in planning better documentation strategies.
Challenge 1: Dynamic Infrastructure
Modern systems use auto-scaling groups. Nodes appear and disappear frequently. A static diagram cannot capture this.
- Solution: Use generalized nodes to represent a group of identical instances rather than drawing every individual server. Add notes about the scaling policies.
Challenge 2: Third-Party Dependencies
Systems often rely on external APIs or SaaS products. These nodes are outside your direct control.
- Solution: Represent these as external nodes with dashed boundaries. Clearly label them as “External Service” to indicate lack of ownership.
Challenge 3: Outdated Documentation
Diagram updates often lag behind code changes.
- Solution: Integrate diagram updates into the deployment pipeline. Require a documentation change as part of the pull request process for infrastructure changes.
Security Implications of Deployment Diagrams 🔒
These diagrams are not just for engineers; they are critical for security audits. They reveal potential attack vectors and compliance gaps.
1. Identifying Single Points of Failure
Review the diagram to find nodes that, if they fail, take down the entire system. This is crucial for business continuity planning.
- Is there only one database node?
- Are all traffic routes dependent on a single router?
2. Network Segmentation
Check if sensitive data nodes are isolated from public-facing nodes. Compliance standards often require strict separation of duties.
- Ensure database nodes are not directly accessible from the internet.
- Verify that administrative interfaces are on a private network.
3. Compliance Mapping
Regulations like GDPR or HIPAA may dictate where data can reside. The diagram should show the geographic location of nodes.
- Label nodes with their physical region or country.
- Mark cross-border data transfers explicitly.
Integrating Diagrams into the Workflow 🔄
A diagram is only useful if people actually look at it. Integrating it into daily workflows ensures it remains relevant.
- Onboarding: Use the diagram to train new engineers on the system architecture.
- Incident Response: Keep a copy available during outages to quickly visualize the topology.
- Capacity Planning: Reference the diagram when estimating resource needs for the next quarter.
Conclusion and Next Steps 🚀
Deployment diagrams are a foundational tool for managing distributed systems. They provide visibility into the complex interactions between hardware and software. By following standard notations, maintaining clear hierarchies, and prioritizing security boundaries, teams can create diagrams that serve as reliable blueprints.
Start by auditing your current documentation. Identify gaps in your topology maps. Then, begin the process of updating your diagrams to reflect the current state of your infrastructure. Regular reviews will ensure that the visual guide remains accurate and useful for your organization.
Remember, the goal is not just to draw a picture, but to facilitate better decision-making across development and operations teams. A clear diagram reduces risk and improves the efficiency of your deployment processes.