


Cloud infrastructure is complex, dynamic, and vast. Without a clear map, navigating the deployment landscape becomes a guessing game. A deployment diagram serves as that map. It visualizes the physical and logical structure of a system, showing how software components interact with the underlying hardware and network resources. For cloud engineers, mastering the creation and interpretation of these diagrams is not just a nice-to-have skill; it is a fundamental requirement for effective architecture design and troubleshooting.
This guide breaks down the essential elements of deployment diagrams, how to construct them without relying on specific tools, and the strategies to keep them relevant in a rapidly changing environment. We will cover the anatomy of the diagram, common patterns, best practices for documentation, and how to maintain accuracy over time.
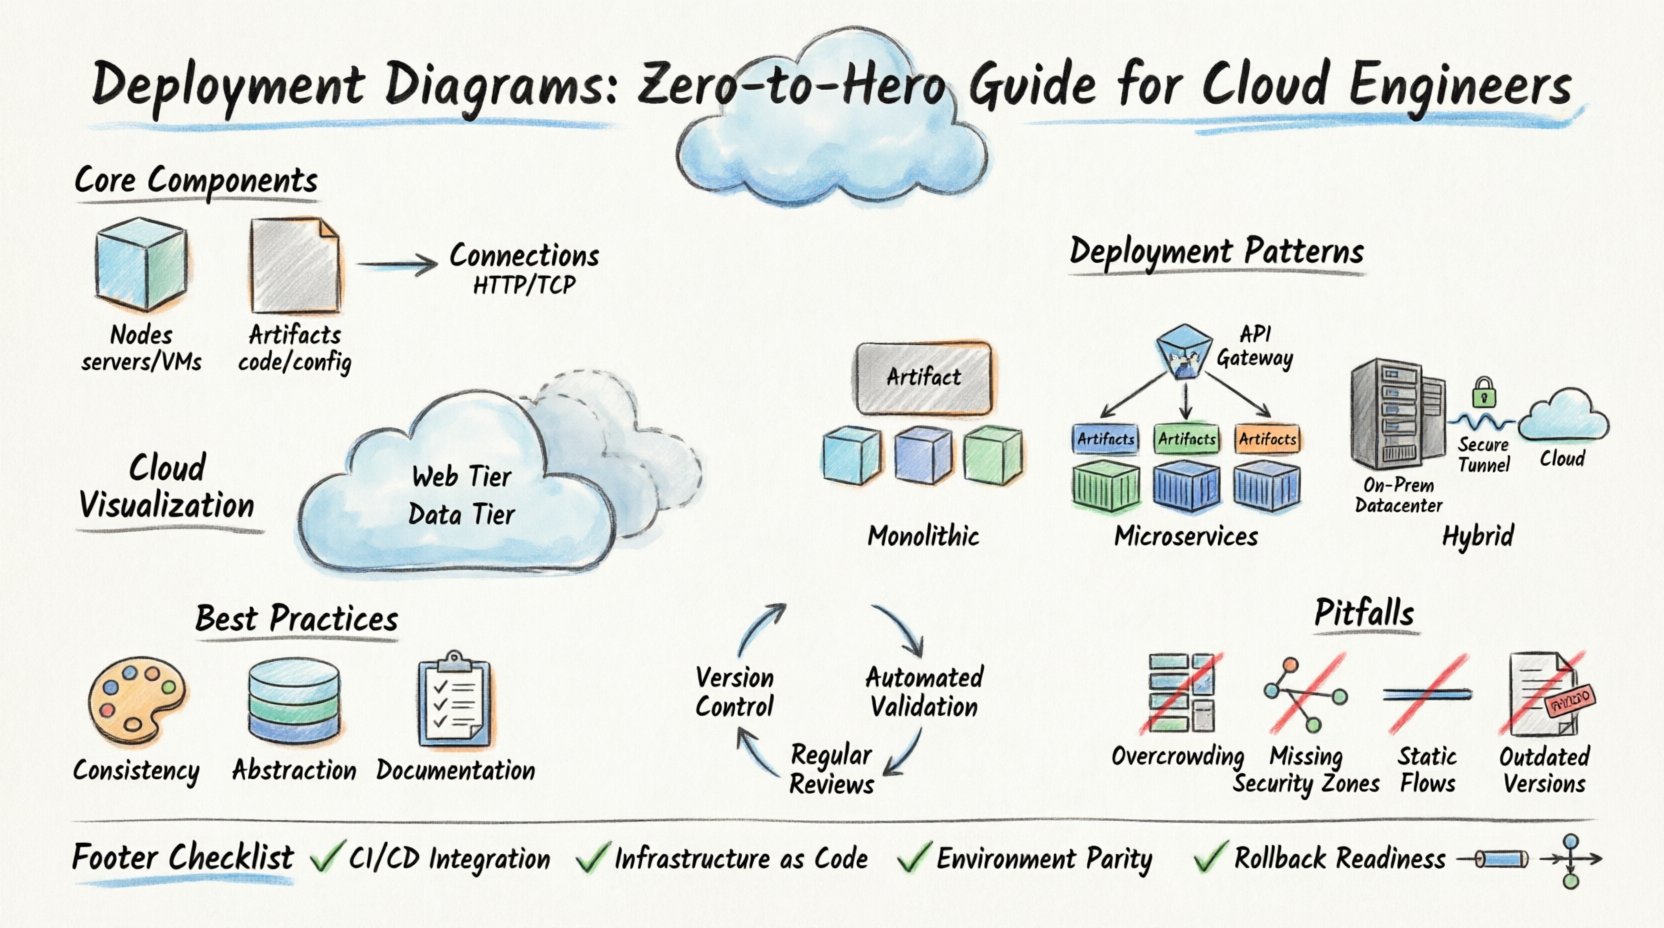
🔍 Understanding the Deployment Diagram
A deployment diagram is a UML (Unified Modeling Language) artifact that depicts the physical deployment of artifacts on nodes. Unlike a sequence diagram which focuses on interaction over time, or a class diagram which focuses on data structures, the deployment diagram focuses on the where and what of the infrastructure.
- Nodes: Represent the computational resources. These can be physical devices like servers, or logical containers like virtual machines.
- Artifacts: Represent the software or data that runs on the nodes. Examples include executables, libraries, databases, or configuration files.
- Connections: Represent the communication channels between nodes. This includes network protocols, APIs, and data flows.
When designing cloud systems, this diagram helps stakeholders understand the boundaries of the system. It clarifies which components are external and which are internal, and how data moves between them. This clarity reduces ambiguity during the development lifecycle and ensures that security policies are applied correctly.
🏗️ Core Components of a Deployment Diagram
To create an accurate representation of your infrastructure, you must understand the specific symbols and relationships used in these diagrams. While standards exist, the core logic remains consistent across different modeling methodologies.
1. Nodes (Computational Resources)
Nodes are the containers for your software. In a cloud context, these are often abstracted, but the diagram must reflect their function.
- Device Node: Represents physical hardware. In the cloud, this might correspond to a physical server in a data center that hosts virtual instances.
- Processing Node: Represents a software environment capable of executing code. This includes virtual machines, containers, or serverless functions.
- Node with Stereotype: A generic node that can be customized. For example, a node labeled as “Database Server” or “Load Balancer”.
2. Artifacts (Deployable Units)
Artifacts are the files or packages that are installed or executed on the nodes. They are the tangible deliverables of your engineering work.
- Software Artifact: Executable files, scripts, or compiled binaries.
- Hardware Artifact: Physical devices or components (less common in logical diagrams but possible).
- Data Artifact: Configuration files, databases, or static content repositories.
3. Associations (Communication Paths)
Connections define how nodes talk to each other. These are critical for understanding latency, security boundaries, and data integrity.
- Communication Path: A directed line showing data flow. It often includes labels indicating the protocol (e.g., HTTP, TCP, REST).
- Dependency: Indicates that one node requires another to function. This is often used to show reliance on external services.
- Realization: Shows that one node implements the interface defined by another.
📊 Comparing Diagram Types
It is common to confuse deployment diagrams with other architectural views. Understanding the distinction ensures you use the right tool for the job. The table below outlines the differences.
| Diagram Type | Primary Focus | Best Used For |
|---|---|---|
| Deployment Diagram | Physical/Logical Infrastructure | Mapping hardware to software, network topology, resource allocation. |
| Sequence Diagram | Interaction Over Time | Understanding API calls, message flow, and request/response cycles. |
| Component Diagram | Software Structure | Organizing code modules, libraries, and their interfaces. |
| Infrastructure Diagram | Network Topology | Firewalls, subnets, routing, and physical connectivity. |
While these diagrams overlap, the deployment diagram specifically bridges the gap between code and the machine it runs on. It answers the question: “Where does this code live, and how does it talk to the rest of the system?”
☁️ Visualizing Cloud Structures
Cloud environments introduce abstraction layers that can make traditional diagrams less intuitive. You must adapt your visualization techniques to reflect the virtual nature of cloud resources.
1. Physical vs. Logical Views
Decide whether your diagram represents the physical hardware or the logical grouping of services. In a cloud environment, physical hardware is often hidden behind a provider’s interface. A logical view is usually more practical.
- Logical View: Focuses on functional groups (e.g., “Web Tier”, “Data Tier”). It ignores the specific IP addresses or physical server locations.
- Physical View: Focuses on specific instances, regions, and availability zones. This is useful for disaster recovery planning and network security configuration.
2. Abstraction Levels
Not every diagram needs to show every microservice. Use layers to manage complexity.
- High-Level: Shows major systems (e.g., “Frontend Application” connecting to “Backend API”).
- Mid-Level: Breaks down the backend into specific services (e.g., “Auth Service”, “Payment Service”).
- Low-Level: Shows individual containers, database shards, and caching layers.
🛠️ Common Deployment Patterns
Different system architectures require different diagrammatic representations. Below are three common patterns used in modern cloud engineering.
1. The Monolithic Deployment
Even in cloud-native environments, monolithic applications persist. In this pattern, a single artifact is deployed across multiple nodes for scalability.
- Structure: One large artifact attached to multiple processing nodes.
- Connectivity: Nodes communicate via internal load balancers.
- Benefit: Simple deployment and configuration management.
2. The Microservices Deployment
This is the most common pattern for scalable cloud applications. Each service runs in its own isolated environment.
- Structure: Multiple artifacts, each deployed to its own node or container group.
- Connectivity: Services communicate via API gateways or service meshes.
- Benefit: Independent scaling and technology diversity.
3. The Hybrid Deployment
Some systems require on-premises hardware combined with cloud resources. This is common in regulated industries.
- Structure: Nodes in a private data center connected to nodes in a public cloud.
- Connectivity: Secure tunnels or dedicated network lines connect the two environments.
- Benefit: Leverages cloud elasticity while keeping sensitive data local.
📝 Best Practices for Diagram Creation
Creating a diagram is easy; creating a useful one requires discipline. Follow these guidelines to ensure your diagrams add value to your engineering workflow.
1. Maintain Consistency
Use consistent notation across all your diagrams. If a cube represents a server in one document, it must represent a server in all documents. Inconsistent symbols confuse readers and introduce errors.
- Define a legend for your organization.
- Use standard colors to indicate status (e.g., green for active, red for failed).
- Keep labels short and descriptive.
2. Focus on Abstraction
Do not clutter the diagram with implementation details that do not affect the architecture. For example, specific IP addresses or version numbers are usually unnecessary unless they are critical to the deployment logic.
- Group related nodes together.
- Hide internal details of a node if the focus is on the connection to the outside.
- Use stereotypes to categorize nodes (e.g., [Database], [Web Server]).
3. Document Assumptions
Every diagram is based on assumptions about the environment. State these clearly to prevent misinterpretation.
- Specify the network protocols used (e.g., HTTPS, gRPC).
- Indicate data encryption requirements.
- Clarify authentication methods between nodes.
🔄 Maintenance and Evolution
Cloud environments are ephemeral. Resources spin up and down automatically. A static diagram quickly becomes obsolete. To keep your documentation useful, you must treat diagrams as living documents.
1. Version Control
Store your diagram files in a version control system alongside your code. This allows you to track changes over time and revert if a diagram no longer matches the infrastructure.
- Commit changes whenever the infrastructure changes.
- Include a changelog in the diagram file metadata.
- Tag releases of the diagram corresponding to application releases.
2. Automated Validation
Manual verification is prone to error. Where possible, use tools to compare the diagram against the actual infrastructure state.
- Implement scripts that query the cloud provider API.
- Generate alerts if a node in the diagram is missing in reality.
- Use Infrastructure as Code (IaC) templates to generate diagram data.
3. Regular Reviews
Schedule periodic reviews of your diagrams with the engineering team. Ensure that the visual representation matches the operational reality.
- Review diagrams during sprint retrospectives.
- Update diagrams before major migration projects.
- Encourage team members to contribute updates.
⚠️ Common Pitfalls to Avoid
Even experienced engineers make mistakes when documenting infrastructure. Be aware of these common traps.
| Pitfall | Consequence | Solution |
|---|---|---|
| Over-Crowding | Readers cannot distinguish important paths from noise. | Split complex systems into multiple diagrams. |
| Ignoring Security Zones | Security boundaries are unclear, leading to vulnerabilities. | Clearly mark firewalls, DMZs, and public/private subnets. |
| Static Data Flows | Fails to show asynchronous or event-driven communication. | Use arrows to indicate direction and label message types. |
| Outdated Versions | Team members deploy incorrect configurations. | Integrate diagram updates into the CI/CD pipeline. |
🔗 Integration with CI/CD Pipelines
Deployment diagrams should not exist in isolation. They must integrate with your automation workflows to ensure that the code matches the infrastructure.
- Pre-Deployment Checks: Verify that the target infrastructure matches the diagram before deploying code.
- Post-Deployment Validation: Confirm that the deployed services match the artifacts defined in the diagram.
- Documentation Generation: Automatically generate diagram images from IaC templates to ensure 100% accuracy.
This integration reduces the risk of configuration drift. When the infrastructure changes, the diagram updates. When the diagram updates, the infrastructure is verified. This feedback loop is essential for reliable cloud operations.
📋 Checklist for Diagram Auditing
Before sharing a deployment diagram with stakeholders, run through this checklist to ensure quality and accuracy.
- Are all nodes labeled with their functional role?
- Are all connections labeled with their protocol?
- Do the security zones align with the organization’s policies?
- Is the diagram readable at a glance?
- Are there any single points of failure that are not documented?
- Does the diagram reflect the current environment state?
- Are external dependencies clearly marked?
- Is the version number of the diagram visible?
🎯 Conclusion
Deployment diagrams are more than just pictures; they are critical communication tools for cloud engineers. They bridge the gap between abstract design and physical reality. By understanding the core components, following best practices, and maintaining a rigorous update cycle, you can ensure your infrastructure documentation remains accurate and useful.
Start by mapping your current systems. Identify the gaps in your documentation. Implement a standard for your team. Over time, these diagrams will become an integral part of your engineering culture, reducing errors and speeding up onboarding for new team members. The goal is clarity, consistency, and reliability in every deployment.
🛠️ Frequently Asked Questions
Q: Can I use deployment diagrams for serverless architectures?
A: Yes. In serverless environments, the “nodes” are often abstracted as execution environments. You should represent these as logical processing units rather than physical servers. Focus on the triggers and the data flow between functions.
Q: How detailed should the diagram be?
A: Detail depends on the audience. For operations teams, include specific resource types and network configurations. For management, focus on high-level flows and critical dependencies. Avoid showing every single file or variable.
Q: Do I need to redraw the diagram for every change?
A: No. Only update the diagram when the structural topology changes. Minor code changes or configuration tweaks within the same node do not require a diagram update.