


Mastering project accountability starts with a clear understanding of who does what. The RACI Matrix Tool from Visual Paradigm is a powerful, web-based application designed to eliminate ambiguity by visualizing roles and responsibilities. This tool allows you to create, manage, and export professional RACI matrices, ensuring every team member knows their role in delivering project outcomes. With a dynamic, interactive grid, you can easily assign Responsible, Accountable, Consulted, and Informed (RACI) statuses to tasks and roles. The interface is intuitive, featuring a clear layout for managing tasks and roles, and it allows for the creation of professional HTML reports for easy sharing. The ability to save your work locally as a JSON file ensures your project data remains secure and under your control. This article provides a deep dive into the features that make this tool indispensable for project managers and team leaders.
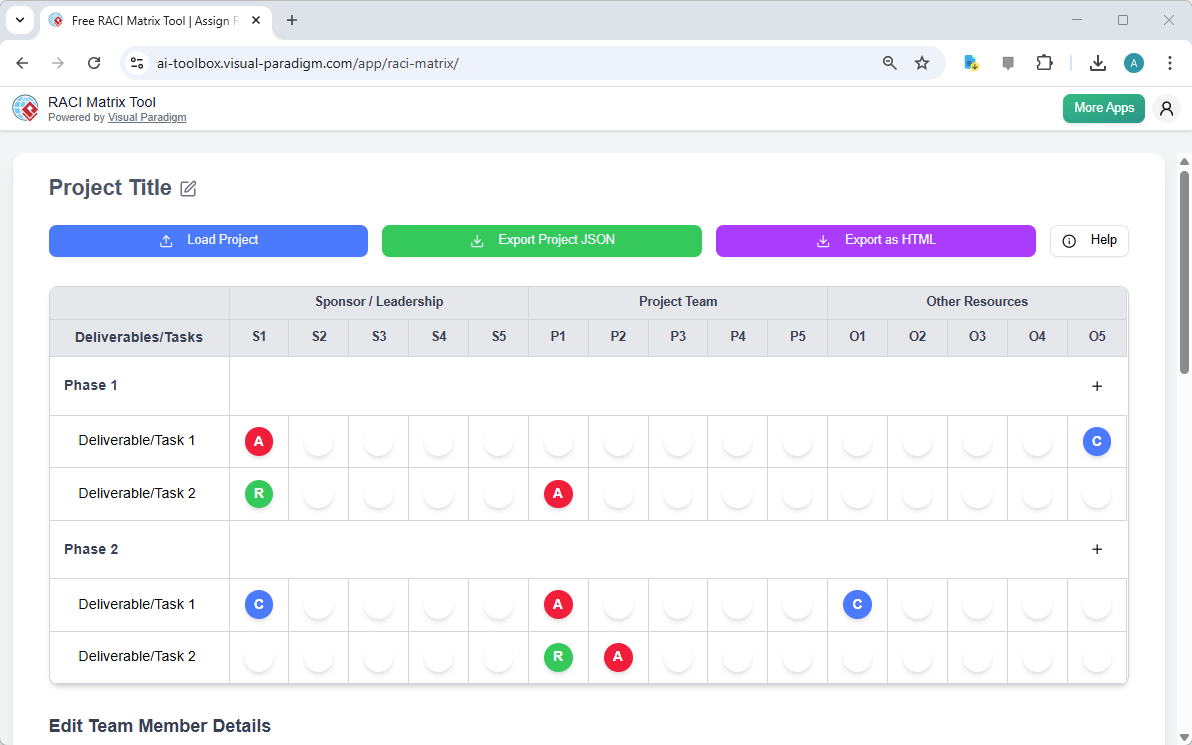
Visual Paradigm‘s RACI Matrix Tool is designed to be a comprehensive solution for defining project roles. The core of the tool is its interactive grid, which is immediately visible in the first image. This grid allows you to organize your project’s deliverables or tasks in the leftmost column and map them against various roles across the top. The intersection of a task and a role creates a cell where you can assign a specific RACI status with a simple click. This visual representation is crucial for ensuring that everyone on the team has a clear understanding of their responsibilities, which in turn fosters accountability and reduces the risk of duplicated effort or critical tasks being overlooked.
Deep Dive: The Interactive RACI Matrix Grid
The heart of the RACI Matrix Tool is its interactive grid, which serves as a dynamic digital whiteboard for your project’s responsibilities. As shown in the first image, the tool is structured with “Deliverables/Tasks” listed vertically and “Roles” listed horizontally. This creates a matrix where each cell at the intersection of a task and a role can be assigned a status. The RACI statuses are represented by distinct colored circles: a red “A” for Accountable, a green “R” for Responsible, a blue “C” for Consulted, and a white “I” for Informed. This color-coding provides an immediate visual cue to the level of involvement for each team member on each task. The process is simple: click on any empty cell, and a pop-up menu appears, allowing you to select the appropriate RACI status. This intuitive interface makes it fast and easy to build and refine your matrix, ensuring that the responsibility assignment process is efficient and accurate.
Defining Team Structure and Assigning Individuals
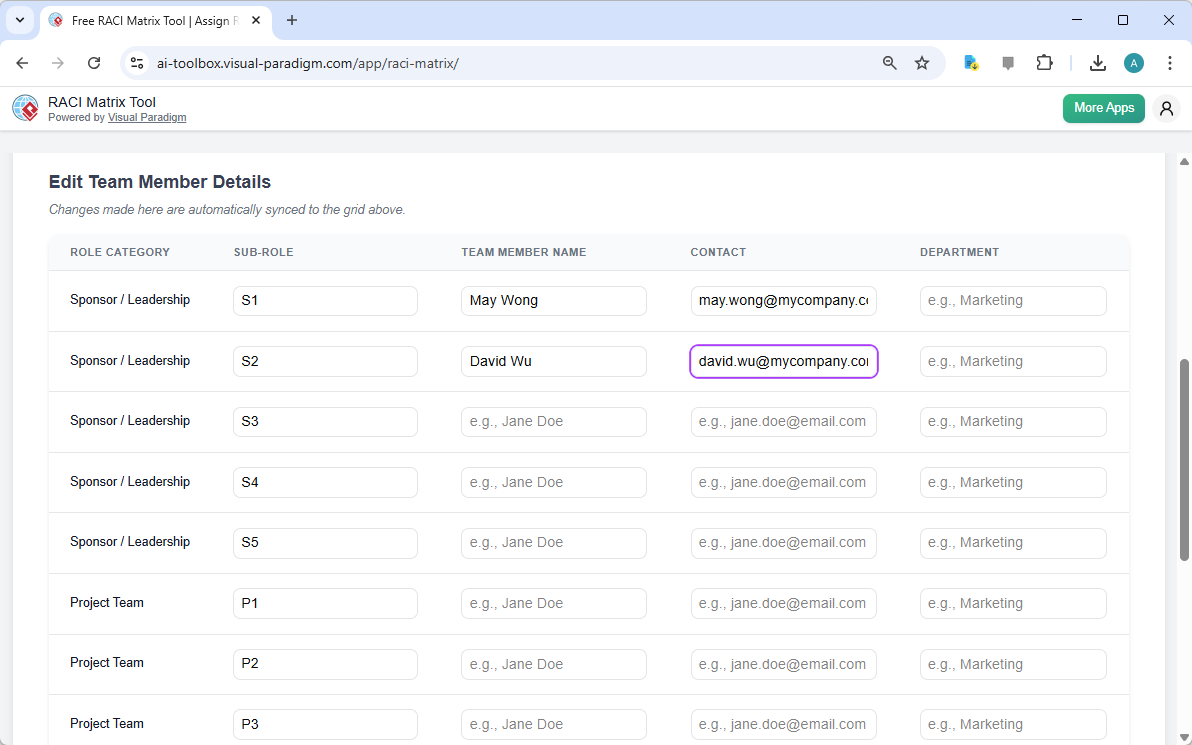
While the RACI grid defines the roles, the second image provides the critical layer of personalization by showing the “Edit Team Member Details” section. This feature allows you to map the abstract sub-roles defined in the matrix to real people. The table clearly lists the “Role Category” (e.g., “Sponsor / Leadership,” “Project Team”) and the “Sub-Role” (e.g., “S1,” “P1”). For each sub-role, you can enter the “Team Member Name,” “Contact” information (like an email address), and the “Department.” This personalization is essential because it transforms the matrix from a theoretical framework into a practical, actionable document. It allows team members to quickly identify who they are, who they report to, and who to contact for information or consultation. The tool ensures that any changes made in the team member details are automatically synced back to the main RACI grid, maintaining data integrity across the entire project.
Key Benefits and Workflows
Using the RACI Matrix Tool offers several key benefits that streamline project management. First, it drastically reduces ambiguity. By explicitly defining who is Responsible for a task, who is Accountable for its success, who needs to be Consulted, and who should be Informed, the tool eliminates the common problem of “I thought you were doing that.” This clarity directly improves accountability, as each task has a single person who is ultimately answerable for its completion (the Accountable role). This leads to faster decision-making, as the chain of command is clear. The tool also streamlines communication by identifying the stakeholders who need to be involved at each stage. For example, if a task requires a decision, the “Consulted” list ensures the right people are engaged, while the “Informed” list ensures everyone is kept up-to-date.
Core Workflows
There are three primary workflows for using the tool effectively:
-
Defining Roles and Responsibilities: Start by setting a project title, then define your role categories and sub-roles. Add your tasks and task groups, then systematically assign RACI statuses to each intersection. Fill in the team member details to complete the picture.
-
Identifying Gaps and Overlaps: Load an existing RACI matrix to audit it. Look for tasks with no “A” (no one accountable) or no “R” (no one responsible), which are gaps. Look for tasks with multiple “A”s, which indicate confusion over accountability. Use the tool to correct these issues.
-
Creating an HTML Report: Once your matrix is complete, use the “Export as HTML” button to generate a professional, self-contained report. This can be printed, saved as a PDF, or shared with stakeholders for formal documentation.
Quick Summary
-
Use the RACI Matrix Tool to create a clear, visual map of project responsibilities.
-
Assign RACI statuses (Responsible, Accountable, Consulted, Informed) to each task-role intersection using a simple, interactive grid.
-
Personalize the matrix by linking sub-roles to actual team members with their names and contact details.
-
Generate a professional HTML report for documentation and sharing.
-
Save your project data locally as a JSON file for future editing and security.
By leveraging the RACI Matrix Tool, you can transform project management from a source of confusion into a structured, efficient process. The tool’s intuitive design and powerful features make it a valuable asset for any team looking to improve collaboration and ensure project success. To get started, visit the official tool page and begin building your first RACI matrix.
Related Links
Project management tools are essential for organizing project scope, tasks, and deliverables to ensure effective planning and execution. Visual Paradigm offers a comprehensive suite that includes Gantt charts, PERT charts, and Work Breakdown Structures (WBS) to track timelines and resources. These tools integrate with platforms like Jira and support structured PMBOK-aligned processes to improve team collaboration and project outcomes.
-
What Is Project Management? A Comprehensive Guide: This guide provides a clear overview of core project management principles, methodologies, and best practices.
-
Practical Guide to Gantt Charts: Master Project Planning & Scheduling: An in-depth resource for mastering Gantt charts to improve project planning and scheduling accuracy.
-
How to Use Work Breakdown Structure (WBS) in Project Management: A detailed tutorial on decomposing project scope into manageable tasks for better organization.
-
Project Management Guide-Through Process Tool: Details an automated tool that provides step-by-step guidance and templates in a centralized repository.
-
Visual Paradigm Jira Integration: Seamless Diagramming and Agile Workflow: Explains how to synchronize visual models directly with Jira to enhance project visibility and traceability.
-
Sprint Planning in Agile: Step-by-Step Guide: A practical guide focusing on backlog prioritization, task breakdown, and team alignment during sprints.
-
The Best PMBOK Tool: Visual Paradigm for Project Management Success: Highlights the benefits of using PMBOK-compliant software for efficient project delivery.
-
Pert Chart for Project Management – Cybermedian: Explores the application of PERT charts for estimating timelines and managing complex schedules.
-
Visual Paradigm Roadmap Tool – Plan and Track Product Development: A resource for building strategic roadmaps that align business goals with development milestones.
-
What is Agile Project Management?: An article defining Agile as a mindset for managing innovation and navigating project risks.