


Effective software architecture relies heavily on clear communication between developers, stakeholders, and system designers. Visual modeling plays a critical role in this process. Among the various tools available, UML diagrams provide a standardized way to represent system behavior. Two specific types often cause confusion regarding their application: the Interaction Overview Diagram (IOD) and the Sequence Diagram. Choosing the right visual representation is not merely a stylistic preference; it is a strategic decision that impacts maintenance, understanding, and development velocity.
This guide provides a detailed analysis of when to utilize an Interaction Overview Diagram versus a Sequence Diagram. We will explore the structural differences, the cognitive load on the reader, and the specific scenarios where one notation outperforms the other. By following established best practices, you can ensure your documentation remains accurate, readable, and useful throughout the software lifecycle.
📊 Understanding the Interaction Overview Diagram (IOD)
An Interaction Overview Diagram is a hybrid model that combines elements of Activity Diagrams with Interaction Diagrams. It is designed to show the flow of control and data among interaction fragments. Unlike a pure Sequence Diagram, which focuses on the linear timeline of messages between objects, the IOD focuses on the high-level orchestration of interactions.
- Control Flow: It uses activity nodes to represent the beginning, end, and decision points of a process.
- Interaction Fragments: It encapsulates entire Sequence Diagrams or other interaction diagrams as nodes within the flow.
- Decision Logic: It clearly visualizes branching paths based on conditions (e.g., if a payment fails, retry or abort).
- Parallelism: It can represent concurrent activities that occur simultaneously across different system components.
The primary strength of the IOD lies in its ability to abstract detail. It allows an architect to present a complex workflow without overwhelming the reader with message-by-message exchanges. It answers the question, “What happens next?” rather than “How do these objects talk right now?”
⏳ Understanding the Sequence Diagram
The Sequence Diagram is the workhorse of object-oriented design. It models the interactions between objects in a sequential order. The vertical axis represents time, and the horizontal axis represents objects (lifelines). Messages are drawn as arrows between these lifelines.
- Time Sensitivity: It explicitly shows the order of operations and can model timing constraints.
- Object Focus: It emphasizes the specific objects involved and their responsibilities.
- Message Detail: It lists parameters, return values, and synchronous versus asynchronous calls.
- Scope: It is best suited for a single use case or a specific scenario within a larger system.
When developers need to understand how to implement a specific function, the Sequence Diagram is often the go-to. It provides the granularity required to write code. However, it can become cluttered when applied to complex workflows with multiple branches and loops.
🔄 Decision Matrix: IOD vs. Sequence
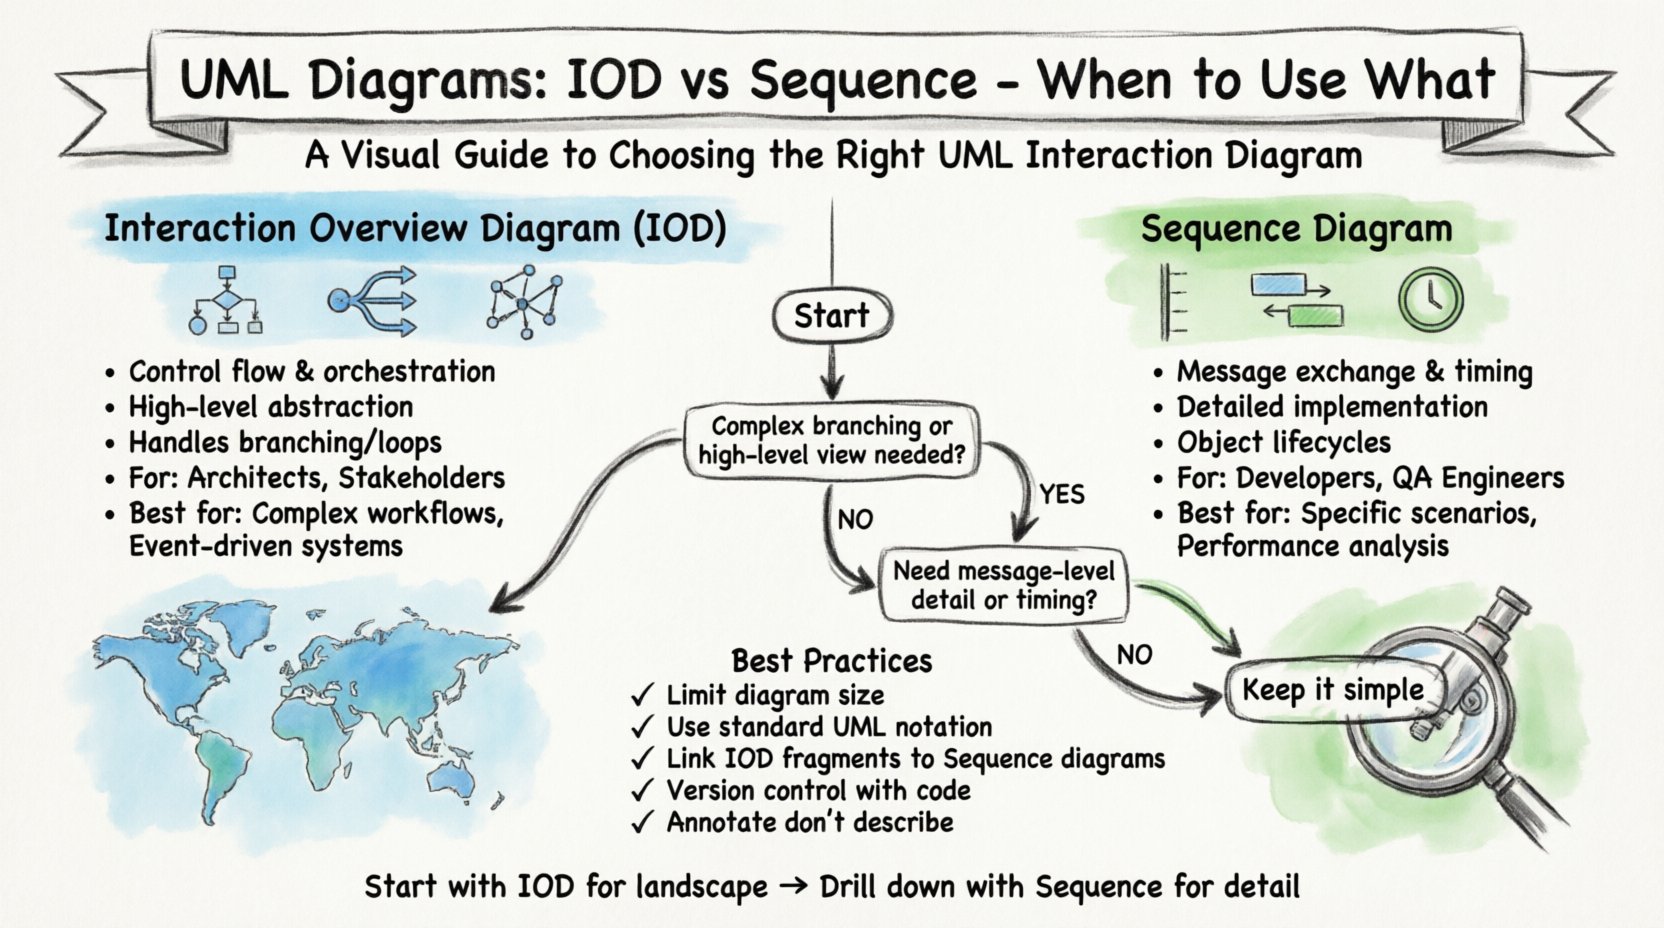
Choosing between these two notations requires evaluating the complexity of the behavior and the audience for the documentation. The following table outlines the key differentiators to assist in decision-making.
| Feature | Interaction Overview Diagram | Sequence Diagram |
|---|---|---|
| Primary Focus | Control flow and orchestration | Message exchange and object lifecycles |
| Granularity | High-level, abstract | Detailed, concrete |
| Complexity Handling | Handles branching and loops well | Struggles with complex branching logic |
| Audience | Architects, Project Managers, Stakeholders | Developers, QA Engineers |
| Maintenance | Lower maintenance for workflow changes | Higher maintenance if logic changes |
| Visual Clarity | Best for large scale processes | Best for specific scenarios |
🚦 When to Stay the Course: Using the Interaction Overview Diagram
There are specific contexts where the Interaction Overview Diagram is the superior choice. Sticking with this notation ensures clarity and prevents the documentation from becoming unreadable.
1. Complex Workflow Orchestration
When a process involves multiple sub-processes that need to happen in a specific order, an IOD is ideal. For example, a user registration flow might involve email verification, profile setup, and database logging. A single Sequence Diagram would be too long and fragmented. An IOD can link these interactions together using activity nodes.
2. Conditional Branching and Loops
Software logic often involves decisions. “If the API returns 500, wait 5 seconds and retry.” “If the user is verified, proceed to checkout.” Sequence diagrams handle simple decisions, but complex decision trees with loops can make the diagram a tangled web. The IOD uses standard activity diagram symbols (diamonds for decisions, bars for loops) to map this logic cleanly.
3. High-Level System Design Reviews
During architectural reviews, stakeholders often do not care about the specific parameters passed between a database and a cache layer. They care about the flow of data through the system. An IOD provides a top-down view that aligns with business processes, making it easier to validate that the system meets requirements without getting bogged down in implementation details.
4. Asynchronous Event Flows
Systems that rely heavily on event-driven architecture can be difficult to model with linear time-based diagrams. An IOD can show that Event A triggers a set of interactions without needing to define the exact timing of every single message exchange.
🔍 When to Switch to Sequence Diagrams
Despite the benefits of the IOD, there are scenarios where the Sequence Diagram is indispensable. Switching to this notation is necessary when precision is the priority.
1. Detailed Implementation Specifications
When a developer begins coding a specific module, they need to know the exact order of calls. An IOD might show that “Service A calls Service B,” but it does not show that Service A must wait for a confirmation token before proceeding. The Sequence Diagram captures these timing dependencies explicitly.
2. Stateful Interactions
If the behavior of an object depends on its current state, a Sequence Diagram can show the state changes through the lifelines. This is crucial for protocols or state machines where the response to a message depends on previous interactions.
3. Performance and Timing Analysis
When performance is a concern, understanding latency is key. Sequence diagrams allow for the annotation of time constraints. For instance, “Response must occur within 200ms.” This level of detail is lost in the abstraction of an Interaction Overview Diagram.
4. Object Creation and Destruction
Memory management and resource allocation are best visualized in Sequence Diagrams. Showing when an object is instantiated, when it holds a reference, and when it is garbage collected helps developers identify potential memory leaks or resource bottlenecks.
🛠️ Transitioning Between Diagrams
It is common to use both diagrams in tandem. The Interaction Overview Diagram acts as the table of contents for the system behavior, while Sequence Diagrams serve as the detailed chapters. Managing the transition between these two requires discipline.
- Linking Fragments: Ensure that the IOD references the specific Sequence Diagrams it contains. Use clear labels or hyperlinks if the documentation is digital.
- Consistency: If a Sequence Diagram is updated, the IOD must reflect any changes in the flow. If the IOD changes, verify that the underlying Sequence Diagrams still align with the new control flow.
- Abstraction Level: Do not mix levels of detail. Do not embed a detailed Sequence Diagram into an IOD if the IOD is meant for high-level management. Conversely, do not summarize a Sequence Diagram in an IOD if the IOD is meant for implementation guidance.
📉 Maintenance and Readability Best Practices
Documentation decays over time. The effort required to maintain diagrams often exceeds the effort to create them. Adhering to best practices now reduces technical debt later.
1. Limit Diagram Size
Keep diagrams focused. If an Interaction Overview Diagram grows too large, it becomes a map of everything rather than a guide to something specific. Break complex workflows into smaller, manageable IODs and link them together.
2. Use Standard Notation
Deviation from UML standards creates confusion. Use standard activity nodes for the IOD and standard message arrows for the Sequence Diagram. Avoid custom symbols unless they are fully documented in a legend.
3. Annotate, Do Not Describe
Use annotations sparingly. If a diagram requires a paragraph of text to explain a node, the diagram is likely too complex. Revisit the model to simplify the logic. Annotations should clarify constraints, not explain the flow.
4. Version Control
Store diagrams in the same repository as the code. This ensures that diagram versions match code versions. When a feature is deprecated, the diagram should be updated or archived immediately.
⚠️ Common Pitfalls to Avoid
Even experienced modelers can fall into traps that reduce the value of their diagrams. Awareness of these common issues helps maintain high quality.
- Over-Abstraction: Using an IOD to explain a simple function. If the logic is linear and simple, a Sequence Diagram or even pseudocode is often faster to read.
- Under-Abstraction: Using a Sequence Diagram to explain a multi-step workflow with branching. This creates a tangled web of arrows that is hard to trace.
- Mixing Concerns: Combining business logic flow with technical infrastructure details in the same diagram. Keep business flow separate from infrastructure implementation.
- Ignoring Lifecycle: Focusing on the happy path only. Diagrams must account for error states, timeouts, and edge cases to be truly useful.
📝 Implementation Checklist
Before finalizing your modeling documentation, run through this checklist to ensure you have selected the right tool for the job.
- ✅ Define the Audience: Are they managers or developers?
- ✅ Assess Complexity: Is there significant branching or looping?
- ✅ Check Time Sensitivity: Does the order of messages matter critically?
- ✅ Review Object Count: Are there too many objects for a clean view?
- ✅ Validate Consistency: Do the diagrams match the code logic?
- ✅ Ensure Maintainability: Is the diagram easy to update when requirements change?
🔗 Integrating with Other Models
Interaction diagrams do not exist in isolation. They are part of a larger ecosystem of models. An IOD often sits above Use Case Diagrams, translating high-level requirements into interaction flows. Sequence Diagrams often complement Class Diagrams, showing how the structure defined in the class model behaves at runtime.
When modeling, ensure that the vocabulary used in the IOD matches the vocabulary in the Class Diagram. If the IOD references a “User Service,” ensure the Class Diagram has a corresponding class or component. This consistency prevents the “lost in translation” problem where the design model does not reflect the implementation model.
💡 Final Thoughts on Modeling Strategy
The choice between an Interaction Overview Diagram and a Sequence Diagram is not binary. It is a spectrum of detail and abstraction. The goal of modeling is not to create art, but to facilitate understanding. If a diagram confuses the reader, it has failed, regardless of its technical accuracy.
Start with the Interaction Overview Diagram to map the landscape. Use Sequence Diagrams to drill down into specific valleys where precision is required. Regularly review your diagrams to ensure they still reflect the reality of the system. Documentation is a living artifact, not a static deliverable. By following these practices, you create a reliable map for your team to navigate the complexity of software development.
Remember, the best diagram is the one that gets read and understood. Choose the tool that best serves that purpose.