Visual Paradigm‘s PlantUML Deployment Diagram Builder is a powerful, web-based tool that simplifies the process of visualizing complex system architectures. This article provides a detailed deep dive into the tool’s features, using a specific example from the provided image: a Scalable Three-Tier Web App deployment. This tool is designed for software architects, DevOps teams, and system administrators who need to document how software components are physically deployed across hardware and networks. By using intuitive forms to define elements and relationships, the builder automatically generates the corresponding PlantUML code and renders a live visual preview, making it easy to create professional diagrams without needing to write code manually.
Key Takeaways:
-
Visual Paradigm’s PlantUML Deployment Diagram Builder enables users to create detailed deployment diagrams using a structured, form-based interface.
-
It provides real-time code generation and a live visual preview, ensuring instant feedback as you build your diagram.
-
Users can define and customize containers (like cloud environments) and entities (like servers and databases) with specific styles and relationships.
-
Projects can be saved locally as JSON files, ensuring data privacy and control.
-
The tool is ideal for visualizing complex architectures, such as a scalable three-tier web application.
Understanding the Example: Scalable Three-Tier Web App
The provided screenshot showcases a practical example of a Scalable Three-Tier Web App deployment, which is a common architectural pattern for modern web applications. This architecture is divided into three logical layers: the Web Tier, the Application Tier, and the Data Tier. Each tier serves a distinct function, and this separation enhances scalability, security, and maintainability. The diagram in the image clearly illustrates how these components are deployed within a virtual private cloud (VPC) environment.
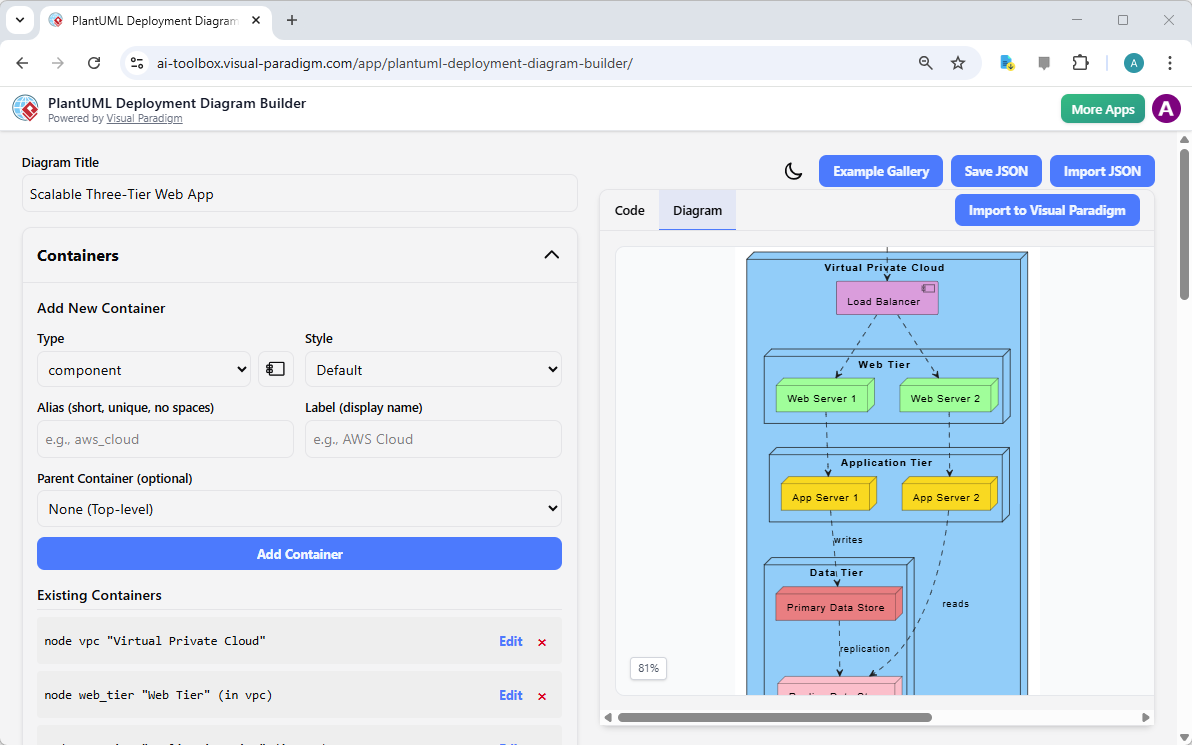
The Web Tier, shown in green, consists of web servers (Web Server 1 and Web Server 2) that handle incoming user requests. These servers are fronted by a Load Balancer, which distributes traffic evenly across them to ensure high availability and prevent any single server from becoming a bottleneck. The Application Tier, depicted in yellow, contains application servers (App Server 1 and App Server 2) that process business logic and interact with the database. Finally, the Data Tier, shown in red, houses the primary data store, which is responsible for persistent data storage. The relationships between these components, such as the web servers writing to the application servers and the application servers reading from the data store, are clearly defined with arrows and labels, illustrating the flow of data and control.
Quick Summary:
-
Web Tier: Hosts web servers and a load balancer to manage user traffic.
-
Application Tier: Contains application servers that execute business logic.
-
Data Tier: Stores the primary data, ensuring persistence and reliability.
-
Relationships are shown with arrows, indicating data flow and dependencies.
Core Features of the PlantUML Deployment Diagram Builder
The tool’s interface is divided into two main sections: the input form on the left and the output display on the right. The left panel, which is visible in the screenshot, allows users to define the components of their deployment diagram. This section is organized into three main categories: Containers, Entities, and Relationships.
Structured Input Forms
Users begin by defining containers, which are logical groupings for deployment elements. In the example, the “Virtual Private Cloud” is defined as a container. The form allows users to specify the container’s type, alias, label, and style. The Alias is a unique identifier used in the PlantUML code, while the Label is the name displayed in the visual diagram. The Style option lets users apply colors to make the diagram more visually appealing and informative. After defining a container, users can add entities, such as the web servers and application servers, within it. The form for entities is similar, allowing users to specify the type (e.g., “node”), alias, label, and style.
Live Code and Visual Preview
The most powerful feature of the builder is its real-time feedback. As users add or modify elements in the input forms, the tool automatically generates the corresponding PlantUML code in the “Code” tab and renders the visual diagram in the “Diagram” tab. This live preview allows users to instantly see the impact of their changes, ensuring that the diagram accurately reflects their intended architecture. This feature is particularly useful for identifying errors or layout issues early in the design process.
Relationships and Customization
Relationships are defined in a dedicated section, where users can specify the connection between two elements, the type of connection (e.g., a dashed line for “reads”), and a label for the relationship. This allows for a clear representation of how different parts of the system interact. Users can also apply various styles and colors to their diagram elements, enhancing readability and visual organization. For instance, in the example, the web servers are colored green, the application servers are yellow, and the data store is red, making it easy to distinguish between the different tiers.
Getting Started with Your Own Diagram
To create a deployment diagram like the one shown in the image, users can follow a simple workflow. First, they set a title for their diagram, such as “Scalable Three-Tier Web App.” Then, they add a container for the “Virtual Private Cloud.” Within this container, they add entities for the “Load Balancer,” “Web Server 1,” and “Web Server 2.” Next, they add a new container for the “Application Tier” and add the “App Server 1” and “App Server 2” entities within it. Finally, they add a container for the “Data Tier” and an entity for the “Primary Data Store.” They then define the relationships between these elements, such as the web servers connecting to the application servers and the application servers connecting to the data store.
Once the diagram is complete, users can save their project as a JSON file using the “Save JSON” button, ensuring that their work is securely stored on their computer. The visual diagram can then be exported as an image or PDF for documentation, presentations, or sharing with team members. This process is straightforward and efficient, making the PlantUML Deployment Diagram Builder an invaluable tool for anyone who needs to visualize and document complex system architectures.
Ready to create your own deployment diagrams? Try the PlantUML Deployment Diagram Builder now and see how it can streamline your architectural documentation process.
Related Links
A deployment diagram is a foundational UML tool used to visualize the physical distribution of software artifacts across various nodes, such as hardware or execution environments. Visual Paradigm provides an advanced toolset for these diagrams, featuring drag-and-drop modeling, real-time collaboration, and full integration with other UML standards. Modern architectural workflows are further enhanced by AI-powered generation for cloud applications and support for PlantUML code-based diagram construction.
-
What is a Deployment Diagram? – A Complete Guide to UML: An essential resource explaining the purpose, components, and best practices for modeling software system architecture.
-
Deployment Diagram Software Features – Visual Paradigm: An overview of capabilities including UML integration and collaborative features for professional modeling.
-
Deployment Diagrams in the Software Design Handbook: This guide offers practical insights into designing scalable and maintainable systems through structural deployment analysis.
-
Step-by-Step Deployment Diagram Tutorial: A hands-on tutorial that walks users through building diagrams from scratch, focusing on nodes, artifacts, and relationships.
-
Deployment Diagram Examples Gallery: A curated collection of real-world examples to inspire and guide system architecture modeling.
-
Free Online Deployment Diagram Tool: A web-based solution for creating professional deployment models instantly without software installation.
-
PlantUML Deployment Diagram Builder: A specialized integration that allows for code-based modeling and visualization using PlantUML syntax.
-
Creating Deployment Diagrams for Cloud Apps with AI: A technical guide on using AI-powered design to efficiently generate deployment diagrams for modern cloud infrastructures.
-
Beginner’s Guide to Deployment Diagrams: An introductory resource for those new to modeling system infrastructure and distribution.
-
Comprehensive Tutorial on Deployment Diagrams: An in-depth tutorial exploring the application of deployment diagrams in complex software engineering projects.