Introduction
State diagrams, also known as state machines or state charts, are essential tools in software engineering and system design. They visually represent the states of an object or system and the transitions between those states in response to events. Visual Paradigm is a robust software suite that supports the creation and management of state diagrams, offering a range of tools and features to streamline the process. This comprehensive guide will walk you through the steps to create and interpret state diagrams in Visual Paradigm, along with key concepts, core elements, tips, and tricks to help you effectively model the behavior of your systems.

Key Concepts in State Diagrams

States
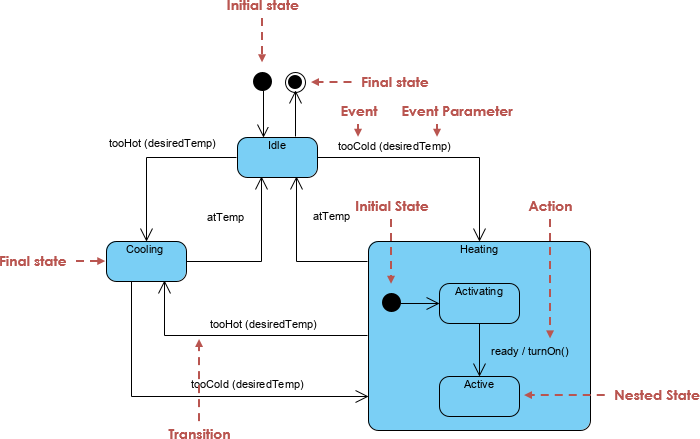
A state represents a condition or situation in which an object exists. States are depicted as rounded rectangles in state diagrams. Each state can have entry actions, exit actions, and internal transitions. These actions are operations performed when entering, exiting, or within a state, respectively.
Transitions
Transitions represent the change from one state to another in response to an event. They are depicted as arrows connecting states. Transitions can have guards (conditions) and actions associated with them. Guards are conditions that must be met for the transition to occur, while actions are operations performed during the transition.
Events
Events are occurrences that trigger transitions between states. They can be external, such as user input, or internal, such as timer expiration. Events are labeled on the transitions that they trigger.
Actions
Actions are operations performed during a transition or within a state. They can be entry actions (performed when entering a state), exit actions (performed when exiting a state), or internal actions (performed within a state). Actions ensure that the system behaves correctly as it moves through different states.
Initial and Final States
The initial state is the starting point of the state diagram, represented by a solid black circle. The final state is the ending point, represented by a concentric circle. These states mark the beginning and end of the system’s behavior.
Core Elements of State Diagrams in Visual Paradigm
In Visual Paradigm, state diagrams include several core elements: states, transitions, events, actions, initial states, and final states. States are represented as rounded rectangles, while transitions are depicted as arrows connecting states. Events are labeled on transitions, and actions are operations performed during transitions or within states. The initial state is represented by a solid black circle, and the final state is represented by a concentric circle.
Steps to Create a State Diagram in Visual Paradigm
1. Create a New Project
To begin, open Visual Paradigm and select Project > New from the toolbar. Enter a project name, such as “My State Diagram,” and click Create Blank Project. This will set up a new project where you can start creating your state diagram.
2. Create a New State Diagram
Next, select Diagram > New from the toolbar. In the New Diagram window, select State Machine Diagram and click Next. Name your diagram, for example, “State Diagram,” and click OK. This will open a new state diagram canvas where you can start adding states and transitions1.
3. Add States
Click on the State tool in the diagram toolbar and click on the diagram canvas to create a new state. Name the state, such as “Idle,” and press Enter to confirm. Repeat this process to add all the necessary states for your system2.
4. Define Transitions
Click on the Transition tool in the diagram toolbar and click on the source state. Drag the arrow to the target state to create a transition. Label the transition with the event that triggers it, such as “Start.” Repeat this process to define all the transitions between states2.
5. Add Initial and Final States
Click on the Initial State tool in the diagram toolbar and click on the diagram canvas to create the initial state. Connect the initial state to the first state in your diagram. Similarly, click on the Final State tool in the diagram toolbar and click on the diagram canvas to create the final state. Connect the final state to the appropriate state in your diagram2.
6. Define Actions and Guards
Right-click on a transition and select Specification from the popup menu. Enter the event, guard (condition), and action for the transition. Repeat this process for other transitions as needed. This ensures that your state diagram accurately represents the behavior of your system2.
7. Review and Refine
Review your state diagram to ensure it accurately represents the behavior of your system. Make adjustments as needed to ensure clarity and accuracy. Collaborate with stakeholders to ensure the state diagram meets their requirements2.
Tips and Tricks for Creating State Diagrams
When creating state diagrams, it is essential to start simple and gradually add complexity as needed. Use descriptive names for states, events, and actions to enhance understanding. Document any assumptions or business rules that are not explicitly represented in the state diagram. Collaborate with stakeholders to ensure the state diagram accurately represents their requirements. For complex systems, use sub-states to break down states into smaller, more manageable parts3.
Interpreting the State Diagram Example
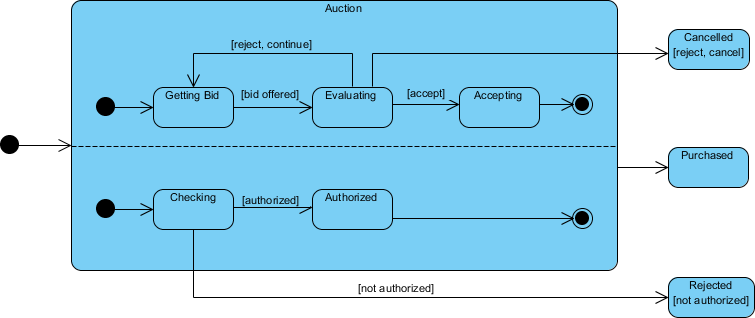
Let’s interpret the state diagram example provided, which models the behavior of an auction system. The diagram includes several states: Getting Bid, Evaluating, Accepting, Checking, Authorized, Cancelled, Purchased, and Rejected.

Getting Bid
This state represents the system receiving bids from participants. If a bid is offered, the system transitions to the Evaluating state. If the bid is rejected, the system transitions to the Cancelled state.
Evaluating
This state represents the system evaluating the received bid. If the bid is accepted, the system transitions to the Accepting state. If the bid is rejected, the system transitions back to the Getting Bid state to continue receiving bids.
Accepting
This state represents the system accepting the bid. If the acceptance is successful, the system transitions to the Purchased state.
Checking
This state represents the system checking the authorization of the bid. If the bid is authorized, the system transitions to the Authorized state. If the bid is not authorized, the system transitions to the Rejected state.
Authorized
This state represents the system with an authorized bid. If the authorization is successful, the system transitions to the Purchased state.
Cancelled
This state represents the system with a cancelled bid. There are no further transitions from this state.
Purchased
This state represents the system with a successfully purchased bid. There are no further transitions from this state.
Rejected
This state represents the system with a rejected bid. There are no further transitions from this state.
Transitions and Events
The transitions between states are triggered by events such as [bid offered], [accept], [reject, continue], [reject, cancel], [authorized], and [not authorized]. These events represent the conditions under which the system moves from one state to another.
Interpretation
This state diagram models the behavior of an auction system, capturing the different states and transitions involved in receiving, evaluating, and accepting bids. The system starts in the Getting Bid state and transitions through various states based on the events and conditions encountered. The diagram effectively represents the flow of the auction process, from receiving bids to finalizing the purchase or rejecting the bid43.
Conclusion
Creating and interpreting state diagrams in Visual Paradigm is a crucial step in modeling the behavior of systems, helping you understand and communicate the states and transitions of your system effectively. By following the steps outlined in this guide and utilizing the tips and examples provided, you can effectively create state diagrams that serve as a solid foundation for your system design process.
References
For further reading and resources, you can refer to the following links:
- What is State Machine Diagram? 4
- How to Draw State Machine Diagram? 2
- State Machine Diagram Tutorial 3
- Online State Machine Diagram Tool 5
- How to Draw a State Machine Diagram in UML? 1
- State machine diagram in Visual Paradigm 6
- How to draw a state machine diagram 7
- State Machine Diagram Templates 8
- All You Need to Know about State Diagrams 9
This comprehensive guide provides an overview of creating and interpreting state diagrams in Visual Paradigm, along with key concepts, tips, and examples to help you effectively model the behavior of your systems. By understanding these concepts and utilizing the tools available, you can design efficient and effective state diagrams that meet your system requirements.